

Illinois District 11
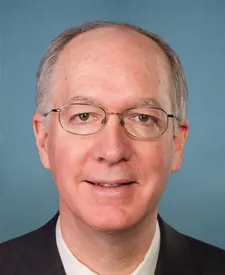
Tue, Nov 3 · Seat held by Bill Foster Democratic since Jan 2013
No published poll names both candidates.Last result · 2024 general: Bill Foster (D) 55.6, Jerry Evans (R) 44.4
- Margin since 2022
- 1.7 points toward Republicans
Side by side
Left column: FosterRight column: Walter
- Total receipts, 2025-2026 cycle, through Oct 14
- $2.6M
- $431K
- Cash on hand
- $2.6M
- $8K
- Donor-based spectrum
- LiberalCentristConservativeFosterNo published score for Walter
Where the money came from
- Individuals
- $1.5M
- $222K
- PACs and other committees
- $991K
- $6K
- Party committees
- $0
- $500
- Candidate’s own money
- $0
- $507
- Loans from the candidate
- $0
- $200K
As each campaign reported to the FEC. Some money has no line here, so these may not add up to the total. Committees giving to Bill Foster. Committees giving to Jeff Walter.
Money: FEC bulk data, through Oct 14. One or more are matched to the FEC by name, party and seat, so a total could belong to someone else.
How these are counted
Total receipts line of each candidate’s principal campaign committee, 2025-2026 cycle. Other sites may show career, six-year or all-committee totals, which differ. Foster: $2,588,027 received, $2,629,689 cash on hand. Walter: $431,415 received, $7,780 cash on hand. The spectrum is a published research score, not our rating. How this works.
Past results
- Votes for listed candidates
- 359,684
- Election day
- November 5, 2024
- District map
- Same as today
US House, Illinois District 11, 2024, every candidate Candidate Party Votes and share Share DemocraticBill FosterWon Democratic 199,82555.6% RepublicanJerry Evans Republican 159,63044.4% OtherAnna Schiefelbein Other 2290.1% - Votes for listed candidates
- 264,241
- Election day
- November 8, 2022
- District map
- Same as today
US House, Illinois District 11, 2022, every candidate Candidate Party Votes and share Share DemocraticBill FosterWon Democratic 149,17256.5% RepublicanCatalina Lauf Republican 115,06943.5% - Votes for listed candidates
- 307,377
- Election day
- November 3, 2020
- District map
- Older district map (2012 to 2020)
US House, Illinois District 11, 2020, every candidate Candidate Party Votes and share Share DemocraticBill FosterWon Democratic 194,55763.3% RepublicanRick Laib Republican 112,80736.7% Jon Harlson Write-in 130.0% - Votes for listed candidates
- 227,765
- Election day
- November 6, 2018
- District map
- Older district map (2012 to 2020)
US House, Illinois District 11, 2018, every candidate Candidate Party Votes and share Share DemocraticBill FosterWon Democratic 145,40763.8% RepublicanNick Stella Republican 82,35836.2%
1976 to 2024: MIT Election Data and Science Lab, U.S. House 1976-2024, retrieved Oct 28, 2026. Compiled by MIT Election Data and Science Lab (MEDSL) from official returns; not an official source
District numbers are reused after each redistricting, so rows on older lines cover different territory than today's Illinois District 11.
All elections (25 for this seat)
- Votes for listed candidates
- 359,684
- Election day
- November 5, 2024
- District map
- Same as today
US House, Illinois District 11, 2024, every candidate Candidate Party Votes and share Share DemocraticBill FosterWon Democratic 199,82555.6% RepublicanJerry Evans Republican 159,63044.4% OtherAnna Schiefelbein Other 2290.1% - Votes for listed candidates
- 264,241
- Election day
- November 8, 2022
- District map
- Same as today
US House, Illinois District 11, 2022, every candidate Candidate Party Votes and share Share DemocraticBill FosterWon Democratic 149,17256.5% RepublicanCatalina Lauf Republican 115,06943.5% - Votes for listed candidates
- 307,377
- Election day
- November 3, 2020
- District map
- Older district map (2012 to 2020)
US House, Illinois District 11, 2020, every candidate Candidate Party Votes and share Share DemocraticBill FosterWon Democratic 194,55763.3% RepublicanRick Laib Republican 112,80736.7% Jon Harlson Write-in 130.0% - Votes for listed candidates
- 227,765
- Election day
- November 6, 2018
- District map
- Older district map (2012 to 2020)
US House, Illinois District 11, 2018, every candidate Candidate Party Votes and share Share DemocraticBill FosterWon Democratic 145,40763.8% RepublicanNick Stella Republican 82,35836.2% - Votes for listed candidates
- 275,573
- Election day
- November 8, 2016
- District map
- Older district map (2012 to 2020)
US House, Illinois District 11, 2016, every candidate Candidate Party Votes and share Share DemocraticBill FosterWon Democratic 166,57860.4% RepublicanTonia Khouri Republican 108,99539.6% - Votes for listed candidates
- 174,772
- Election day
- November 4, 2014
- District map
- Older district map (2012 to 2020)
US House, Illinois District 11, 2014, every candidate Candidate Party Votes and share Share DemocraticBill FosterWon Democratic 93,43653.5% RepublicanDarlene Senger Republican 81,33546.5% OtherConstant "Conner" Vlakancic Other 10.0% - Votes for listed candidates
- 254,295
- Election day
- November 6, 2012
- District map
- Older district map (2012 to 2020)
US House, Illinois District 11, 2012, every candidate Candidate Party Votes and share Share DemocraticBill FosterWon Democratic 148,92858.6% RepublicanJudy Biggert Republican 105,34841.4% Scattered write-insName as filed: Writein Write-in 190.0% - Votes for listed candidates
- 225,127
- Election day
- November 2, 2010
- District map
- Older district map (2002 to 2010)
US House, Illinois District 11, 2010, every candidate Candidate Party Votes and share Share RepublicanAdam KinzingerWon Republican 129,10857.3% DemocraticDeborah L Halvorson Democratic 96,01942.7% - Votes for listed candidates
- 317,895
- Election day
- November 4, 2008
- District map
- Older district map (2002 to 2010)
US House, Illinois District 11, 2008, every candidate Candidate Party Votes and share Share DemocraticDeborah "Debbie" HalvorsonWon Democratic 185,65258.4% RepublicanMarty Ozinga Republican 109,60834.5% GreenJason M Wallace Green 22,6357.1% - Votes for listed candidates
- 197,855
- Election day
- November 7, 2006
- District map
- Older district map (2002 to 2010)
US House, Illinois District 11, 2006, every candidate Candidate Party Votes and share Share RepublicanJerry WellerWon Republican 109,00955.1% DemocraticJohn Pavich Democratic 88,84644.9% - Votes for listed candidates
- 294,960
- Election day
- November 2, 2004
- District map
- Older district map (2002 to 2010)
US House, Illinois District 11, 2004, every candidate Candidate Party Votes and share Share RepublicanJerry WellerWon Republican 173,05758.7% DemocraticTari Renner Democratic 121,90341.3% - Votes for listed candidates
- 193,085
- Election day
- November 5, 2002
- District map
- Older district map (2002 to 2010)
US House, Illinois District 11, 2002, every candidate Candidate Party Votes and share Share RepublicanJerry WellerWon Republican 124,19264.3% DemocraticKeith S Van Duyne Democratic 68,89335.7% - Votes for listed candidates
- 234,869
- Election day
- November 7, 2000
- District map
- Older district map (1992 to 2000)
US House, Illinois District 11, 2000, every candidate Candidate Party Votes and share Share RepublicanJerry WellerWon Republican 132,38456.4% DemocraticJames P Stevenson Democratic 102,48543.6% - Votes for listed candidates
- 171,055
- Election day
- November 3, 1998
- District map
- Older district map (1992 to 2000)
US House, Illinois District 11, 1998, every candidate Candidate Party Votes and share Share RepublicanJerry WellerWon Republican 100,59758.8% DemocraticGary S Mueller Democratic 70,45841.2% - Votes for listed candidates
- 212,284
- Election day
- November 5, 1996
- District map
- Older district map (1992 to 2000)
US House, Illinois District 11, 1996, every candidate Candidate Party Votes and share Share RepublicanJerry WellerWon Republican 109,89651.8% DemocraticClem Balanoff Democratic 102,38848.2% - Votes for listed candidates
- 160,395
- Election day
- November 8, 1994
- District map
- Older district map (1992 to 2000)
US House, Illinois District 11, 1994, every candidate Candidate Party Votes and share Share RepublicanJerry WellerWon Republican 97,24160.6% DemocraticFrank Giglio Democratic 63,15039.4% Scattered write-insName as filed: Writein Write-in 40.0% - Votes for listed candidates
- 243,247
- Election day
- November 3, 1992
- District map
- Older district map (1992 to 2000)
US House, Illinois District 11, 1992, every candidate Candidate Party Votes and share Share DemocraticGeorge E SangmeisterWon Democratic 135,38755.7% RepublicanRobert T Herbolsheimer Republican 107,86044.3% - Votes for listed candidates
- 154,245
- Election day
- November 6, 1990
- District map
- Older district map (1982 to 1990)
US House, Illinois District 11, 1990, every candidate Candidate Party Votes and share Share DemocraticFrank AnnunzioWon Democratic 82,70353.6% RepublicanWalter W Dudycz Republican 68,85044.6% OtherLarry Saska Other 2,6921.7% - Votes for listed candidates
- 204,242
- Election day
- November 8, 1988
- District map
- Older district map (1982 to 1990)
US House, Illinois District 11, 1988, every candidate Candidate Party Votes and share Share DemocraticFrank AnnunzioWon Democratic 131,75364.5% RepublicanGeorge S Gottlieb Republican 72,48935.5% - Votes for listed candidates
- 151,311
- Election day
- November 4, 1986
- District map
- Older district map (1982 to 1990)
US House, Illinois District 11, 1986, every candidate Candidate Party Votes and share Share DemocraticFrank AnnunzioWon Democratic 106,97070.7% RepublicanGeorge S Gottlieb Republican 44,34129.3% - Votes for listed candidates
- 220,690
- Election day
- November 6, 1984
- District map
- Older district map (1982 to 1990)
US House, Illinois District 11, 1984, every candidate Candidate Party Votes and share Share DemocraticFrank AnnunzioWon Democratic 138,17162.6% RepublicanCharles J Theusch Republican 82,51837.4% OtherOther Other 10.0% - Votes for listed candidates
- 185,722
- Election day
- November 2, 1982
- District map
- Older district map (1982 to 1990)
US House, Illinois District 11, 1982, every candidate Candidate Party Votes and share Share DemocraticFrank AnnunzioWon Democratic 134,75572.6% RepublicanJames F Moynihan Republican 50,96727.4% - Votes for listed candidates
- 173,587
- Election day
- November 4, 1980
- District map
- Older district map (1972 to 1980)
US House, Illinois District 11, 1980, every candidate Candidate Party Votes and share Share DemocraticFrank AnnunzioWon Democratic 121,16669.8% RepublicanMichael R Zanillo Republican 52,41730.2% Scattered write-insName as filed: Writein Write-in 40.0% - Votes for listed candidates
- 152,412
- Election day
- November 7, 1978
- District map
- Older district map (1972 to 1980)
US House, Illinois District 11, 1978, every candidate Candidate Party Votes and share Share DemocraticFrank AnnunzioWon Democratic 112,36573.7% RepublicanJohn Hoeger Republican 40,04426.3% Scattered write-insName as filed: Writein Write-in 30.0% - Votes for listed candidates
- 201,440
- Election day
- November 2, 1976
- District map
- Older district map (1972 to 1980)
US House, Illinois District 11, 1976, every candidate Candidate Party Votes and share Share DemocraticFrank AnnunzioWon Democratic 135,75567.4% RepublicanDaniel C Reber Republican 65,68032.6% Scattered write-insName as filed: Writein Write-in 50.0%
More about this race
Party nominees only, not the certified ballot.
Source: elections.il.gov, dated Oct 28
Shift since 2022: 1.7 points toward Republicans (Democratic by 12.9 in 2022, Democratic by 11.2 in 2024).
All Illinois districts
- D 15+ pts
- D 5 to 15 pts
- D under 5 pts
- R under 5 pts
- R 5 to 15 pts
- R 15+ pts
- Other winner
- No data
Show these districts as a list (17)
- Illinois District 1· Jonathan L. Jackson (D), Democratic by 31.7 points, 2024
- Illinois District 2· Robin L. Kelly (D), Democratic by 35.1 points, 2024
- Illinois District 3· Delia C. Ramirez (D), Democratic by 34.6 points, 2024
- Illinois District 4· Jesús G. "Chuy" García (D), Democratic by 40.2 points, 2024
- Illinois District 5· Mike Quigley (D), Democratic by 37.9 points, 2024
- Illinois District 6· Sean Casten (D), Democratic by 8.4 points, 2024
- Illinois District 7· Danny K. Davis (D), Democratic by 66.6 points, 2024
- Illinois District 8· Raja Krishnamoorthi (D), Democratic by 14.1 points, 2024
- Illinois District 9· Janice D. Schakowsky (D), Democratic by 36.8 points, 2024
- Illinois District 10· Bradley Scott Schneider (D), Democratic by 19.9 points, 2024
- Illinois District 11· Bill Foster (D), Democratic by 11.2 points, 2024
- Illinois District 12· Mike Bost (R), Republican by 48.4 points, 2024
- Illinois District 13· Nikki Budzinski (D), Democratic by 16.2 points, 2024
- Illinois District 14· Lauren Underwood (D), Democratic by 10.2 points, 2024
- Illinois District 15· Mary E. Miller (R), Republican by 99.1 points, 2024
- Illinois District 16· Darin LaHood (R), Republican by 99.9 points, 2024
- Illinois District 17· Eric Sorensen (D), Democratic by 8.9 points, 2024
Map settings
Vote in Illinois
Trouble voting? Election Protection hotline: 866-OUR-VOTE. A nonpartisan coalition of civil-rights and voting-rights groups, not a government service. 866ourvote.org
Download and cite
Cite this page
Election Wrld. (2026). Illinois District 11, US House results. https://www.electionwrld.com/il/congress/11. Retrieved October 31, 2026.
Embed this seat
<iframe src="https://www.electionwrld.com/embed/il/congress/11" title="Illinois District 11, US House" width="100%" height="400" style="border:0;max-width:640px" loading="lazy"></iframe>
<p style="font-size:13px">Data: <a href="https://www.electionwrld.com">Election Wrld</a>, CC BY 4.0</p>Sources
Sources: MIT Election Data and Science Lab, U.S. House 1976-2024 (CC0 1.0), retrieved Oct 28, 2026, compiled by MIT Election Data and Science Lab (MEDSL) from official returns, not an official source; Census TIGERweb Legislative MapServer (120th CDs layer 0, 119th CDs layer 4, 2026 SLD upper layer 1 and lower layer 2) (US Census Bureau, public domain), retrieved Oct 28, 2026; unitedstates/congress-legislators (current) (CC0-1.0), retrieved Oct 28, 2026, compiled by the @unitedstates project volunteers (rosters from official congressional sources) from official returns, not an official source.
DataState data (JSON)Sources: MIT Election Data and Science Lab, U.S. House 1976-2024, FEC, DIME (ODC-BY), Portraits: unitedstates/images (public domain)Data as of Oct 28, 2026