

Michigan District 7
Tue, Nov 3 · Seat held by Tom Barrett Republican since Jan 2025
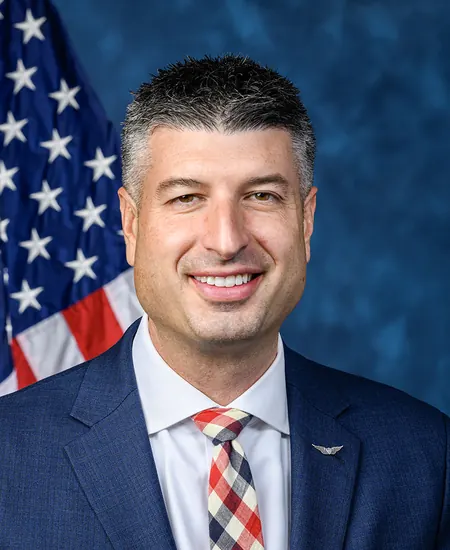
Tom Barrett 45William Lawrence 53
Only 1 poll in the last 7 weeksNewest poll · Emerson College, field dates Oct 12 to Oct 14, released Oct 22, 314 likely votersPoll sponsored by Poll VaultPolls fetched Oct 30, 2:02 a.m. ET, from VoteHub
Show all 3 candidates on the ballot
- William LawrenceDemocratic
- Tom BarrettIncumbentRepublican
- Shane DedrickGreen
Showing major-party nominees, incumbents and candidates with 5%+ in the latest poll or comparable fundraising.
- Last election
- Tom Barrett (Republican) won by 3.7 points, 2024
- Margin since 2022
- 9.1 points toward Republicans
- On the 2026 ballot
- 3 candidates
Polls over time
2 polls, through Election Day Nov 3All polls. Polls fetched Oct 30, 2:02 a.m. ET, from VoteHub.
The polls in this chart (2)
1 poll released in the last 14 days · latest results range from 49 to 53% (D) and 45 to 47% (R) (newest 2 polls on the chart)
2 of the 4 polls for this race, each with both names, plotted on the field end date.
| Pollster | Field dates | Released | Sample | Lawrence | Barrett |
|---|---|---|---|---|---|
| Emerson College | Oct 12 to Oct 14 | Oct 22 | 314 likely voters | 53 | 45 |
| Global Strategy Group | Aug 11 to Aug 13 | Aug 20 | 500 likely voters | 49 | 47 |
Polls left off the chart (2 of 4)
| Poll | Why it is not on the chart |
|---|---|
| Public Policy PollingOct 27 to Oct 28 | Names fewer than two candidates on this ballot (lists Tom Barrett, Matt Maasdam) |
| Public Policy PollingOct 27 to Oct 28 | Names fewer than two candidates on this ballot (lists Tom Barrett, Bridget Brink) |
Side by side
Left column: BarrettRight column: Lawrence
- Total receipts, 2025-2026 cycle, through Oct 14
- $8.2M
- $4.2M
- Cash on hand
- $1.0M
- $629K
- Donor-based spectrum
- LiberalCentristConservativeBarrettNo published score for Lawrence
- Races won and lost
- 4-1
- None on file
- Years since first win on file
- 1
- Not available
- Age on Election Day
- 45
- Not available
Money: FEC bulk data, through Oct 14. One or more are matched to the FEC by name, party and seat, so a total could belong to someone else.
How these are counted
Total receipts line of each candidate’s principal campaign committee, 2025-2026 cycle. Other sites may show career, six-year or all-committee totals, which differ. Barrett: $8,238,468 received, $1,039,763 cash on hand. Lawrence: $4,160,041 received, $628,966 cash on hand. The spectrum is a published research score, not our rating. How this works. Wins and losses count the races in our results files, the same as each profile.
What changed in this race
Newest firstNEW POLLMichigan District 7
Michigan District 7: William Lawrence 53, Tom Barrett 45
Emerson College, Oct 12 to Oct 14, 314 likely voters
More about this race
Candidates on the ballot
- William LawrenceDemocratic
- Tom BarrettIncumbentRepublican
- Shane DedrickGreen
Source: mi-boe.entellitrak.com, dated Oct 28
Shift since 2022: 9.1 points toward Republicans (Democratic by 5.4 in 2022, Republican by 3.7 in 2024). Changed party, D to R.
All Michigan districts
- D 15+ pts
- D 5 to 15 pts
- D under 5 pts
- R under 5 pts
- R 5 to 15 pts
- R 15+ pts
- Other winner
- No data
Show these districts as a list (13)
- Michigan District 1· Jack Bergman (R), Republican by 21.3 points, 2024
- Michigan District 2· John R. Moolenaar (R), Republican by 33.4 points, 2024
- Michigan District 3· Hillary J. Scholten (D), Democratic by 9.9 points, 2024
- Michigan District 4· Bill Huizenga (R), Republican by 11.7 points, 2024
- Michigan District 5· Tim Walberg (R), Republican by 32.9 points, 2024
- Michigan District 6· Debbie Dingell (D), Democratic by 27.0 points, 2024
- Michigan District 7· Tom Barrett (R), Republican by 3.7 points, 2024
- Michigan District 8· Kristen McDonald Rivet (D), Democratic by 6.7 points, 2024
- Michigan District 9· Lisa C. McClain (R), Republican by 37.3 points, 2024
- Michigan District 10· John James (R), Republican by 6.1 points, 2024
- Michigan District 11· Haley M. Stevens (D), Democratic by 18.6 points, 2024
- Michigan District 12· Rashida Tlaib (D), Democratic by 44.3 points, 2024
- Michigan District 13· Shri Thanedar (D), Democratic by 44.1 points, 2024
Map settings
Vote in Michigan
- Register
- Registration, polling place, mail ballot status
- Sample ballot lookup, election office
- ID rules
Trouble voting? Election Protection hotline: 866-OUR-VOTE. A nonpartisan coalition of civil-rights and voting-rights groups, not a government service. 866ourvote.org
History (25 elections for this seat)
- Votes for listed candidates
- 450,912
- Election day
- November 5, 2024
- District map
- Same as today
US House, Michigan District 7, 2024, every candidate Candidate Party Votes and share Share RepublicanTom BarrettWon Republican 226,72250.3% DemocraticCurtis Hertel Democratic 209,95946.6% LibertarianL. Rachel Dailey Libertarian 14,2313.2% - Votes for listed candidates
- 372,708
- Election day
- November 8, 2022
- District map
- Same as today
US House, Michigan District 7, 2022, every candidate Candidate Party Votes and share Share DemocraticElissa SlotkinWon Democratic 192,80951.7% RepublicanTom Barrett Republican 172,62446.3% LibertarianLeah R Dailey Libertarian 7,2752.0% - Votes for listed candidates
- 387,267
- Election day
- November 3, 2020
- District map
- Older district map (2012 to 2020)
US House, Michigan District 7, 2020, every candidate Candidate Party Votes and share Share RepublicanTim WalbergWon Republican 227,52458.8% DemocraticGretchen D Driskell Democratic 159,74341.2% - Votes for listed candidates
- 295,060
- Election day
- November 6, 2018
- District map
- Older district map (2012 to 2020)
US House, Michigan District 7, 2018, every candidate Candidate Party Votes and share Share RepublicanTim WalbergWon Republican 158,73053.8% DemocraticGretchen Driskell Democratic 136,33046.2% - Votes for listed candidates
- 334,807
- Election day
- November 8, 2016
- District map
- Older district map (2012 to 2020)
US House, Michigan District 7, 2016, every candidate Candidate Party Votes and share Share RepublicanTim WalbergWon Republican 184,32155.1% DemocraticGretchen D Driskell Democratic 134,01040.0% LibertarianKen Proctor Libertarian 16,4764.9% - Votes for listed candidates
- 223,685
- Election day
- November 4, 2014
- District map
- Older district map (2012 to 2020)
US House, Michigan District 7, 2014, every candidate Candidate Party Votes and share Share RepublicanTim WalbergWon Republican 119,56453.5% DemocraticPam Byrnes Democratic 92,08341.2% LibertarianKen Proctor Libertarian 4,5312.0% IndependentDavid Swartout Independent 4,3692.0% OtherRick Strawcutter Other 3,1381.4% - Votes for listed candidates
- 318,069
- Election day
- November 6, 2012
- District map
- Older district map (2012 to 2020)
US House, Michigan District 7, 2012, every candidate Candidate Party Votes and share Share RepublicanTim WalbergWon Republican 169,66853.3% DemocraticKurt Richard Haskell Democratic 136,84943.0% LibertarianKen Proctor Libertarian 8,0882.5% GreenRichard E Wunsch Green 3,4641.1% - Votes for listed candidates
- 225,669
- Election day
- November 2, 2010
- District map
- Older district map (2002 to 2010)
US House, Michigan District 7, 2010, every candidate Candidate Party Votes and share Share RepublicanTim WalbergWon Republican 113,18550.2% DemocraticMark H Schauer Democratic 102,40245.4% OtherScott Eugene Aughney Other 3,7051.6% LibertarianGreg Merle Libertarian 3,2391.4% GreenRichard Wunsch Green 3,1171.4% Scattered write-insName as filed: Writein Write-in 210.0% - Votes for listed candidates
- 322,286
- Election day
- November 4, 2008
- District map
- Older district map (2002 to 2010)
US House, Michigan District 7, 2008, every candidate Candidate Party Votes and share Share DemocraticMark SchauerWon Democratic 157,21348.8% RepublicanTim Walberg Republican 149,78146.5% GreenLynn Meadows Green 9,5283.0% LibertarianKen Proctor Libertarian 5,6751.8% Scattered write-insName as filed: Writein Write-in 890.0% - Votes for listed candidates
- 245,026
- Election day
- November 7, 2006
- District map
- Older district map (2002 to 2010)
US House, Michigan District 7, 2006, every candidate Candidate Party Votes and share Share RepublicanTim WalbergWon Republican 122,34849.9% DemocraticSharon Marie Renier Democratic 112,66546.0% LibertarianRobert L Hutchinson Libertarian 3,7881.5% OtherDavid Horn Other 3,6111.5% Scattered write-insName as filed: Writein Write-in 2,6141.1% - Votes for listed candidates
- 301,642
- Election day
- November 2, 2004
- District map
- Older district map (2002 to 2010)
US House, Michigan District 7, 2004, every candidate Candidate Party Votes and share Share RepublicanJoe SchwarzWon Republican 176,05358.4% DemocraticSharon Marie Renier Democratic 109,52736.3% OtherDavid Horn Other 9,0323.0% GreenJason Seagraves Green 3,9961.3% LibertarianKenneth Proctor Libertarian 3,0341.0% - Votes for listed candidates
- 203,069
- Election day
- November 5, 2002
- District map
- Older district map (2002 to 2010)
US House, Michigan District 7, 2002, every candidate Candidate Party Votes and share Share RepublicanNick SmithWon Republican 121,14259.7% DemocraticMike Simpson Democratic 78,41238.6% LibertarianKen Proctor Libertarian 3,5151.7% - Votes for listed candidates
- 241,010
- Election day
- November 7, 2000
- District map
- Older district map (1992 to 2000)
US House, Michigan District 7, 2000, every candidate Candidate Party Votes and share Share RepublicanNick SmithWon Republican 147,36961.1% DemocraticJennie Crittendon Democratic 86,08035.7% OtherPerry Spencer Other 2,3591.0% LibertarianRobert Broda Jr Libertarian 2,1580.9% OtherSteve Cousino Other 1,8780.8% OtherGail Anne Petrosoff Other 1,1590.5% Scattered write-insName as filed: Writein Write-in 70.0% - Votes for listed candidates
- 182,127
- Election day
- November 3, 1998
- District map
- Older district map (1992 to 2000)
US House, Michigan District 7, 1998, every candidate Candidate Party Votes and share Share RepublicanNick SmithWon Republican 104,65657.5% DemocraticJim Berryman Democratic 72,99840.1% LibertarianKenneth L Proctor Libertarian 2,6841.5% OtherLynnea Ellison Other 1,7891.0% - Votes for listed candidates
- 218,544
- Election day
- November 5, 1996
- District map
- Older district map (1992 to 2000)
US House, Michigan District 7, 1996, every candidate Candidate Party Votes and share Share RepublicanNick SmithWon Republican 120,22755.0% DemocraticKim H Tunnicliff Democratic 93,72542.9% LibertarianRobert F Broda Jr Libertarian 3,0901.4% OtherScott K Williamson Other 1,4710.7% Scattered write-insName as filed: Writein Write-in 310.0% - Votes for listed candidates
- 177,500
- Election day
- November 8, 1994
- District map
- Older district map (1992 to 2000)
US House, Michigan District 7, 1994, every candidate Candidate Party Votes and share Share RepublicanNick SmithWon Republican 115,62165.1% DemocraticKim McCaughtry Democratic 57,32632.3% LibertarianKenneth L Proctor Libertarian 3,3111.9% OtherScott K Williamson Other 1,2230.7% Scattered write-insName as filed: Writein Write-in 190.0% - Votes for listed candidates
- 152,868
- Election day
- November 3, 1992
- District map
- Older district map (1992 to 2000)
US House, Michigan District 7, 1992, every candidate Candidate Party Votes and share Share RepublicanNick SmithWon Republican 133,97287.6% LibertarianKenneth L Proctor Libertarian 18,75112.3% Scattered write-insName as filed: Writein Write-in 1450.1% - Votes for listed candidates
- 132,068
- Election day
- November 6, 1990
- District map
- Older district map (1982 to 1990)
US House, Michigan District 7, 1990, every candidate Candidate Party Votes and share Share DemocraticDale E KildeeWon Democratic 90,30768.4% RepublicanDavid J Morrill Republican 41,75931.6% Scattered write-insName as filed: Writein Write-in 20.0% - Votes for listed candidates
- 199,080
- Election day
- November 8, 1988
- District map
- Older district map (1982 to 1990)
US House, Michigan District 7, 1988, every candidate Candidate Party Votes and share Share DemocraticDale E KildeeWon Democratic 150,83275.8% RepublicanJeff Coad Republican 47,07123.6% OtherGary Walkowicz Other 1,1740.6% OtherOther Other 30.0% - Votes for listed candidates
- 127,172
- Election day
- November 4, 1986
- District map
- Older district map (1982 to 1990)
US House, Michigan District 7, 1986, every candidate Candidate Party Votes and share Share DemocraticDale E KildeeWon Democratic 101,22579.6% RepublicanTrudie Callihan Republican 24,84819.5% IndependentGene Schenk Independent 1,0990.9% - Votes for listed candidates
- 155,748
- Election day
- November 6, 1984
- District map
- Older district map (1982 to 1990)
US House, Michigan District 7, 1984, every candidate Candidate Party Votes and share Share DemocraticDale E KildeeWon Democratic 145,07093.1% IndependentSamuel Johnson Jr Independent 10,6636.8% OtherOther Other 150.0% - Votes for listed candidates
- 157,254
- Election day
- November 2, 1982
- District map
- Older district map (1982 to 1990)
US House, Michigan District 7, 1982, every candidate Candidate Party Votes and share Share DemocraticDale E KildeeWon Democratic 118,53875.4% RepublicanGeorge R Darrah Republican 36,30323.1% LibertarianDennis L Berry Libertarian 1,8421.2% OtherDavid Freund Other 5680.4% Scattered write-insName as filed: Writein Write-in 30.0% - Votes for listed candidates
- 158,803
- Election day
- November 4, 1980
- District map
- Older district map (1972 to 1980)
US House, Michigan District 7, 1980, every candidate Candidate Party Votes and share Share DemocraticDale E KildeeWon Democratic 147,28092.7% LibertarianDennis L Berry Libertarian 11,5077.2% Scattered write-insName as filed: Writein Write-in 160.0% - Votes for listed candidates
- 137,540
- Election day
- November 7, 1978
- District map
- Older district map (1972 to 1980)
US House, Michigan District 7, 1978, every candidate Candidate Party Votes and share Share DemocraticDale E KildeeWon Democratic 105,40276.6% RepublicanGale M Cronk Republican 29,95821.8% OtherJimmy L Sabin Other 2,1791.6% Scattered write-insName as filed: Writein Write-in 10.0% - Votes for listed candidates
- 177,582
- Election day
- November 2, 1976
- District map
- Older district map (1972 to 1980)
US House, Michigan District 7, 1976, every candidate Candidate Party Votes and share Share DemocraticDale E KildeeWon Democratic 124,26070.0% RepublicanRobin Widgery Republican 50,30128.3% OtherJimmy L Sabin Other 1,4510.8% OtherMax Dean Other 8350.5% LibertarianBenjamin G Hoffman Libertarian 7350.4%
1976 to 2024: MIT Election Data and Science Lab, U.S. House 1976-2024, retrieved Oct 28, 2026. Compiled by MIT Election Data and Science Lab (MEDSL) from official returns; not an official source
District numbers are reused after each redistricting, so rows on older lines cover different territory than today's Michigan District 7.
Download and cite
Cite this page
Election Wrld. (2026). Michigan District 7, US House results. https://www.electionwrld.com/mi/congress/7. Retrieved October 30, 2026.
Embed this seat
<iframe src="https://www.electionwrld.com/embed/mi/congress/7" title="Michigan District 7, US House" width="100%" height="400" style="border:0;max-width:640px" loading="lazy"></iframe>
<p style="font-size:13px">Data: <a href="https://www.electionwrld.com">Election Wrld</a>, CC BY 4.0</p>Sources
Sources: MIT Election Data and Science Lab, U.S. House 1976-2024 (CC0 1.0), retrieved Oct 28, 2026, compiled by MIT Election Data and Science Lab (MEDSL) from official returns, not an official source; Census TIGERweb Legislative MapServer (120th CDs layer 0, 119th CDs layer 4, 2026 SLD upper layer 1 and lower layer 2) (US Census Bureau, public domain), retrieved Oct 28, 2026; unitedstates/congress-legislators (current) (CC0-1.0), retrieved Oct 28, 2026, compiled by the @unitedstates project volunteers (rosters from official congressional sources) from official returns, not an official source.
DataState data (JSON)Sources: MIT Election Data and Science Lab, U.S. House 1976-2024, VoteHub polls (CC BY 4.0), FEC, DIME (ODC-BY), Photo creditsData as of Oct 28, 2026