

Oklahoma District 3
Tue, Nov 3 · Seat held by Frank D. Lucas Republican since May 1993
No published poll names both candidates.Last result · 2024 general: Frank D. Lucas (R) 100.0
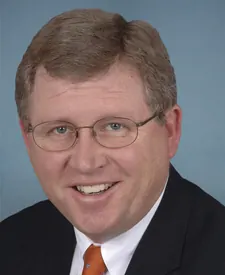
- Last election
- Frank D. Lucas (Republican) was unopposed, 2024
- On the 2026 ballot
- 2 candidates
Side by side
Left column: ByrdRight column: Lucas
- Total receipts, 2025-2026 cycle, through Oct 14
- $18K
- $1.1M
- Cash on hand
- $10K
- $570K
- Donor-based spectrum
- LiberalCentristConservativeLucasNo published score for Byrd
- Races
- None listed
- Won 16 of 16
- Years since first win
- Not available
- 33
- Age on Election Day
- Not available
- 66
Money: FEC bulk data, through Oct 14. One or more are matched to the FEC by name, party and seat, so a total could belong to someone else.
How these are counted
Total receipts line of each candidate’s principal campaign committee, 2025-2026 cycle. Other sites may show career, six-year or all-committee totals, which differ. Byrd: $18,188 received, $9,508 cash on hand. Lucas: $1,055,085 received, $570,474 cash on hand. The spectrum is a published research score, not our rating. How this works. Wins and losses count the races in our results files, the same as each profile.
More about this race
Candidates on the ballot
- Suzie ByrdDemocratic
- Frank D. LucasIncumbentRepublican
Source: hosting.okelections.us, dated Oct 28
Shift since 2022: not available. A race had one candidate on the ballot, so no margin.
All Oklahoma districts
- D 15+ pts
- D 5 to 15 pts
- D under 5 pts
- R under 5 pts
- R 5 to 15 pts
- R 15+ pts
- Other winner
- No data
Show these districts as a list (5)
- Oklahoma District 1· Kevin Hern (R), Republican by 25.9 points, 2024
- Oklahoma District 2· Josh Brecheen (R), Republican by 52.8 points, 2024
- Oklahoma District 3· Frank D. Lucas (R), unopposed, 2024
- Oklahoma District 4· Tom Cole (R), Republican by 36.9 points, 2024
- Oklahoma District 5· Stephanie I. Bice (R), Republican by 21.4 points, 2024
Map settings
Vote in Oklahoma
- Register
- Registration, polling place, sample ballot lookup, mail ballot status, election office
- ID rules
Trouble voting? Election Protection hotline: 866-OUR-VOTE. A nonpartisan coalition of civil-rights and voting-rights groups, not a government service. 866ourvote.org
History (25 elections for this seat)
- Election day
- November 5, 2024
- District map
- Same as today
US House, Oklahoma District 3, 2024, every candidate Candidate Party Votes and share Share RepublicanFrank D. LucasWon Republican —100.0% - Votes for listed candidates
- 197,772
- Election day
- November 8, 2022
- District map
- Same as today
US House, Oklahoma District 3, 2022, every candidate Candidate Party Votes and share Share RepublicanFrank D. LucasWon Republican 147,41874.5% DemocraticJeremiah A Ross Democratic 50,35425.5% - Votes for listed candidates
- 309,178
- Election day
- November 3, 2020
- District map
- Older district map (2012 to 2020)
US House, Oklahoma District 3, 2020, every candidate Candidate Party Votes and share Share RepublicanFrank D. LucasWon Republican 242,67778.5% DemocraticZoe Midyett Democratic 66,50121.5% - Votes for listed candidates
- 234,065
- Election day
- November 6, 2018
- District map
- Older district map (2012 to 2020)
US House, Oklahoma District 3, 2018, every candidate Candidate Party Votes and share Share RepublicanFrank D. LucasWon Republican 172,91373.9% DemocraticFrankie Robbins Democratic 61,15226.1% - Votes for listed candidates
- 290,615
- Election day
- November 8, 2016
- District map
- Older district map (2012 to 2020)
US House, Oklahoma District 3, 2016, every candidate Candidate Party Votes and share Share RepublicanFrank D. LucasWon Republican 227,52578.3% DemocraticFrankie Robbins Democratic 63,09021.7% - Votes for listed candidates
- 169,605
- Election day
- November 4, 2014
- District map
- Older district map (2012 to 2020)
US House, Oklahoma District 3, 2014, every candidate Candidate Party Votes and share Share RepublicanFrank D. LucasWon Republican 133,33578.6% DemocraticFrankie Robbins Democratic 36,27021.4% - Votes for listed candidates
- 268,003
- Election day
- November 6, 2012
- District map
- Older district map (2012 to 2020)
US House, Oklahoma District 3, 2012, every candidate Candidate Party Votes and share Share RepublicanFrank D. LucasWon Republican 201,74475.3% DemocraticTimothy Ray Murray Democratic 53,47220.0% IndependentWilliam M Sanders Independent 12,7874.8% - Votes for listed candidates
- 207,616
- Election day
- November 2, 2010
- District map
- Older district map (2002 to 2010)
US House, Oklahoma District 3, 2010, every candidate Candidate Party Votes and share Share RepublicanFrank D. LucasWon Republican 161,92778.0% DemocraticFrankie Robbins Democratic 45,68922.0% - Votes for listed candidates
- 264,359
- Election day
- November 4, 2008
- District map
- Older district map (2002 to 2010)
US House, Oklahoma District 3, 2008, every candidate Candidate Party Votes and share Share RepublicanFrank D. LucasWon Republican 184,30669.7% DemocraticFrankie Robbins Democratic 62,29723.6% IndependentForrest Michael Independent 17,7566.7% - Votes for listed candidates
- 189,791
- Election day
- November 7, 2006
- District map
- Older district map (2002 to 2010)
US House, Oklahoma District 3, 2006, every candidate Candidate Party Votes and share Share RepublicanFrank D. LucasWon Republican 128,04267.5% DemocraticSue Barton Democratic 61,74932.5% - Votes for listed candidates
- 262,131
- Election day
- November 2, 2004
- District map
- Older district map (2002 to 2010)
US House, Oklahoma District 3, 2004, every candidate Candidate Party Votes and share Share RepublicanFrank D. LucasWon Republican 215,51082.2% IndependentGregory M Wilson Independent 46,62117.8% - Votes for listed candidates
- 196,090
- Election day
- November 5, 2002
- District map
- Older district map (2002 to 2010)
US House, Oklahoma District 3, 2002, every candidate Candidate Party Votes and share Share RepublicanFrank D. LucasWon Republican 148,20675.6% IndependentRobert T Murphy Independent 47,88424.4% - Votes for listed candidates
- 159,216
- Election day
- November 7, 2000
- District map
- Older district map (1992 to 2000)
US House, Oklahoma District 3, 2000, every candidate Candidate Party Votes and share Share RepublicanWes WatkinsWon Republican 137,82686.6% IndependentArgus W Yandell Jr Independent 14,6609.2% LibertarianR C Sevier White Libertarian 6,7304.2% - Votes for listed candidates
- 144,995
- Election day
- November 3, 1998
- District map
- Older district map (1992 to 2000)
US House, Oklahoma District 3, 1998, every candidate Candidate Party Votes and share Share RepublicanWes WatkinsWon Republican 89,83262.0% DemocraticWalt Roberts Democratic 55,16338.0% - Votes for listed candidates
- 191,508
- Election day
- November 5, 1996
- District map
- Older district map (1992 to 2000)
US House, Oklahoma District 3, 1996, every candidate Candidate Party Votes and share Share RepublicanWes WatkinsWon Republican 98,52651.4% DemocraticDarryl Roberts Democratic 86,64745.2% IndependentScott Demaree Independent 6,3353.3% - Votes for listed candidates
- 156,878
- Election day
- November 8, 1994
- District map
- Older district map (1992 to 2000)
US House, Oklahoma District 3, 1994, every candidate Candidate Party Votes and share Share DemocraticBill K BrewsterWon Democratic 115,73173.8% RepublicanDarrel Dewayne Tallant Republican 41,14726.2% - Votes for listed candidates
- 207,659
- Election day
- November 3, 1992
- District map
- Older district map (1992 to 2000)
US House, Oklahoma District 3, 1992, every candidate Candidate Party Votes and share Share DemocraticBill K BrewsterWon Democratic 155,93475.1% RepublicanRobert W Stokes Republican 51,72524.9% - Votes for listed candidates
- 133,902
- Election day
- November 6, 1990
- District map
- Older district map (1982 to 1990)
US House, Oklahoma District 3, 1990, every candidate Candidate Party Votes and share Share DemocraticBill K BrewsterWon Democratic 107,64180.4% RepublicanPatrick K Miller Republican 26,26119.6% - Election day
- November 8, 1988
- District map
- Older district map (1982 to 1990)
US House, Oklahoma District 3, 1988, every candidate Candidate Party Votes and share Share DemocraticWes WatkinsWon Democratic —100.0% - Votes for listed candidates
- 145,921
- Election day
- November 4, 1986
- District map
- Older district map (1982 to 1990)
US House, Oklahoma District 3, 1986, every candidate Candidate Party Votes and share Share DemocraticWes WatkinsWon Democratic 114,00878.1% RepublicanPatrick K Miller Republican 31,91321.9% - Votes for listed candidates
- 177,418
- Election day
- November 6, 1984
- District map
- Older district map (1982 to 1990)
US House, Oklahoma District 3, 1984, every candidate Candidate Party Votes and share Share DemocraticWes WatkinsWon Democratic 137,96477.8% RepublicanPatrick K Miller Republican 39,45422.2% - Votes for listed candidates
- 148,005
- Election day
- November 2, 1982
- District map
- Older district map (1982 to 1990)
US House, Oklahoma District 3, 1982, every candidate Candidate Party Votes and share Share DemocraticWes WatkinsWon Democratic 121,67082.2% RepublicanPatrick K Miller Republican 26,33517.8% - Election day
- November 4, 1980
- District map
- Older district map (1972 to 1980)
US House, Oklahoma District 3, 1980, every candidate Candidate Party Votes and share Share DemocraticWes WatkinsWon Democratic —100.0% - Election day
- November 7, 1978
- District map
- Older district map (1972 to 1980)
US House, Oklahoma District 3, 1978, every candidate Candidate Party Votes and share Share DemocraticWesley Wade WatkinsWon Democratic —100.0% - Votes for listed candidates
- 184,565
- Election day
- November 2, 1976
- District map
- Older district map (1972 to 1980)
US House, Oklahoma District 3, 1976, every candidate Candidate Party Votes and share Share DemocraticWes WatkinsWon Democratic 151,27182.0% RepublicanGerald Beasley Jr Republican 31,73217.2% IndependentJack C Finley Independent 1,5620.8%
1976 to 2024: MIT Election Data and Science Lab, U.S. House 1976-2024, retrieved Oct 28, 2026. Compiled by MIT Election Data and Science Lab (MEDSL) from official returns; not an official source
District numbers are reused after each redistricting, so rows on older lines cover different territory than today's Oklahoma District 3.
Download and cite
Cite this page
Election Wrld. (2026). Oklahoma District 3, US House results. https://www.electionwrld.com/ok/congress/3. Retrieved October 31, 2026.
Embed this seat
<iframe src="https://www.electionwrld.com/embed/ok/congress/3" title="Oklahoma District 3, US House" width="100%" height="400" style="border:0;max-width:640px" loading="lazy"></iframe>
<p style="font-size:13px">Data: <a href="https://www.electionwrld.com">Election Wrld</a>, CC BY 4.0</p>Sources
Sources: MIT Election Data and Science Lab, U.S. House 1976-2024 (CC0 1.0), retrieved Oct 28, 2026, compiled by MIT Election Data and Science Lab (MEDSL) from official returns, not an official source; Census TIGERweb Legislative MapServer (120th CDs layer 0, 119th CDs layer 4, 2026 SLD upper layer 1 and lower layer 2) (US Census Bureau, public domain), retrieved Oct 28, 2026; unitedstates/congress-legislators (current) (CC0-1.0), retrieved Oct 28, 2026, compiled by the @unitedstates project volunteers (rosters from official congressional sources) from official returns, not an official source.
DataState data (JSON)Sources: MIT Election Data and Science Lab, U.S. House 1976-2024, FEC, DIME (ODC-BY), Portraits: unitedstates/images (public domain)Data as of Oct 28, 2026