

South Carolina District 3
Tue, Nov 3 · Seat held by Sheri Biggs Republican since Jan 2025
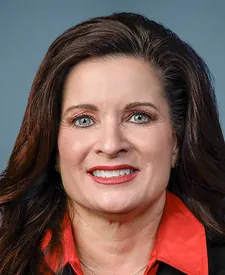
No published poll names both candidates.Last result · 2024 general: Sheri Biggs (R) 71.7, Bryon L. Best (D) 25.3, Mike Bedenbaugh (O) 2.9
Show all 3 candidates on the ballot
- Eunice LehmacherDemocratic
- Sheri BiggsIncumbentRepublican
- Brian CorrieaLibertarian
Showing major-party nominees, incumbents and candidates with 5%+ in the latest poll or comparable fundraising.
- Last election
- Sheri Biggs (Republican) won by 46.4 points, 2024
- On the 2026 ballot
- 3 candidates
Side by side
Left column: BiggsRight column: Lehmacher
- Total receipts, 2025-2026 cycle, through Oct 14
- $707K
- $99K
- Cash on hand
- $201K
- $22K
- Donor-based spectrum
- LiberalCentristConservativeBiggsNo published score for Lehmacher
- Races won and lost
- 1-0
- None on file
- Years since first win on file
- 1
- Not available
- Age on Election Day
- 56
- Not available
Money: FEC bulk data, through Oct 14. One or more are matched to the FEC by name, party and seat, so a total could belong to someone else.
How these are counted
Total receipts line of each candidate’s principal campaign committee, 2025-2026 cycle. Other sites may show career, six-year or all-committee totals, which differ. Biggs: $706,779 received, $201,218 cash on hand. Lehmacher: $98,662 received, $21,976 cash on hand. The spectrum is a published research score, not our rating. How this works. Wins and losses count the races in our results files, the same as each profile.
More about this race
Candidates on the ballot
- Eunice LehmacherDemocratic
- Sheri BiggsIncumbentRepublican
- Brian CorrieaLibertarian
Source: vrems.scvotes.sc.gov, dated Oct 28
Shift since 2022: not available. A race had one candidate on the ballot, so no margin.
All South Carolina districts
- D 15+ pts
- D 5 to 15 pts
- D under 5 pts
- R under 5 pts
- R 5 to 15 pts
- R 15+ pts
- Other winner
- No data
Show these districts as a list (7)
- South Carolina District 1· Nancy Mace (R), Republican by 16.6 points, 2024
- South Carolina District 2· Joe Wilson (R), Republican by 19.3 points, 2024
- South Carolina District 3· Sheri Biggs (R), Republican by 46.4 points, 2024
- South Carolina District 4· William R. Timmons IV (R), Republican by 22.5 points, 2024
- South Carolina District 5· Ralph Norman (R), Republican by 27.2 points, 2024
- South Carolina District 6· James E. Clyburn (D), Democratic by 22.8 points, 2024
- South Carolina District 7· Russell Fry (R), Republican by 29.9 points, 2024
Map settings
Vote in South Carolina
Trouble voting? Election Protection hotline: 866-OUR-VOTE. A nonpartisan coalition of civil-rights and voting-rights groups, not a government service. 866ourvote.org
Official results for South Carolina
History (25 elections for this seat)
- Votes for listed candidates
- 346,713
- Election day
- November 5, 2024
- District map
- Same as today
US House, South Carolina District 3, 2024, every candidate Candidate Party Votes and share Share RepublicanSheri BiggsWon Republican 248,45171.7% DemocraticBryon L. Best Democratic 87,73525.3% OtherMike Bedenbaugh Other 9,9182.9% Scattered write-insName as filed: Writein Write-in 6090.2% - Votes for listed candidates
- 194,569
- Election day
- November 8, 2022
- District map
- Same as today
US House, South Carolina District 3, 2022, every candidate Candidate Party Votes and share Share RepublicanJeff DuncanWon Republican 189,97197.6% Scattered write-insName as filed: Writein Write-in 4,5982.4% - Votes for listed candidates
- 333,564
- Election day
- November 3, 2020
- District map
- Older district map (2012 to 2020)
US House, South Carolina District 3, 2020, every candidate Candidate Party Votes and share Share RepublicanJeff DuncanWon Republican 237,54471.2% DemocraticHosea Cleveland Democratic 95,71228.7% Scattered write-insName as filed: Writein Write-in 3080.1% - Votes for listed candidates
- 226,204
- Election day
- November 6, 2018
- District map
- Older district map (2012 to 2020)
US House, South Carolina District 3, 2018, every candidate Candidate Party Votes and share Share RepublicanJeff DuncanWon Republican 153,33867.8% DemocraticMary Geren Democratic 70,04631.0% OtherDave Moore Other 2,6971.2% Scattered write-insName as filed: Writein Write-in 1230.1% - Votes for listed candidates
- 269,540
- Election day
- November 8, 2016
- District map
- Older district map (2012 to 2020)
US House, South Carolina District 3, 2016, every candidate Candidate Party Votes and share Share RepublicanJeff DuncanWon Republican 196,32572.8% DemocraticHosea Cleveland Democratic 72,93327.1% Scattered write-insName as filed: Writein Write-in 2820.1% - Votes for listed candidates
- 164,009
- Election day
- November 4, 2014
- District map
- Older district map (2012 to 2020)
US House, South Carolina District 3, 2014, every candidate Candidate Party Votes and share Share RepublicanJeff DuncanWon Republican 116,74171.2% DemocraticBarbara Jo Mullis Democratic 47,18128.8% Scattered write-insName as filed: Writein Write-in 870.1% - Votes for listed candidates
- 254,763
- Election day
- November 6, 2012
- District map
- Older district map (2012 to 2020)
US House, South Carolina District 3, 2012, every candidate Candidate Party Votes and share Share RepublicanJeff DuncanWon Republican 169,51266.5% DemocraticBrian Ryan B Doyle Democratic 84,73533.3% Scattered write-insName as filed: Writein Write-in 5160.2% - Votes for listed candidates
- 202,108
- Election day
- November 2, 2010
- District map
- Older district map (2002 to 2010)
US House, South Carolina District 3, 2010, every candidate Candidate Party Votes and share Share RepublicanJeff DuncanWon Republican 126,23562.5% DemocraticJane Ballard Dyer Democratic 73,09536.2% OtherJohn Dalen Other 2,6821.3% Scattered write-insName as filed: Writein Write-in 960.0% - Votes for listed candidates
- 288,741
- Election day
- November 4, 2008
- District map
- Older district map (2002 to 2010)
US House, South Carolina District 3, 2008, every candidate Candidate Party Votes and share Share RepublicanJ Gresham BarrettWon Republican 186,79964.7% DemocraticJane Ballard Dyer Democratic 101,72435.2% Scattered write-insName as filed: Writein Write-in 2180.1% - Votes for listed candidates
- 177,988
- Election day
- November 7, 2006
- District map
- Older district map (2002 to 2010)
US House, South Carolina District 3, 2006, every candidate Candidate Party Votes and share Share RepublicanJ Gresham BarrettWon Republican 111,88262.9% DemocraticLee Ballenger Democratic 66,03937.1% Scattered write-insName as filed: Writein Write-in 670.0% - Votes for listed candidates
- 191,999
- Election day
- November 2, 2004
- District map
- Older district map (2002 to 2010)
US House, South Carolina District 3, 2004, every candidate Candidate Party Votes and share Share RepublicanJ Gresham BarrettWon Republican 191,05299.5% Scattered write-insName as filed: Writein Write-in 9470.5% - Votes for listed candidates
- 178,195
- Election day
- November 5, 2002
- District map
- Older district map (2002 to 2010)
US House, South Carolina District 3, 2002, every candidate Candidate Party Votes and share Share RepublicanJ Gresham BarrettWon Republican 119,64467.1% DemocraticGeorge L Brightharp Democratic 55,74331.3% LibertarianMike Boerste Libertarian 2,7851.6% Scattered write-insName as filed: Writein Write-in 230.0% - Votes for listed candidates
- 221,621
- Election day
- November 7, 2000
- District map
- Older district map (1992 to 2000)
US House, South Carolina District 3, 2000, every candidate Candidate Party Votes and share Share RepublicanLindsey O GrahamWon Republican 150,18067.8% DemocraticGeorge Brightharp Democratic 67,17030.3% LibertarianAdrian Banks Libertarian 3,1161.4% OtherLeroy J Klein Other 1,1220.5% Scattered write-insName as filed: Writein Write-in 330.0% - Votes for listed candidates
- 129,449
- Election day
- November 3, 1998
- District map
- Older district map (1992 to 2000)
US House, South Carolina District 3, 1998, every candidate Candidate Party Votes and share Share RepublicanLindsey O GrahamWon Republican 129,04799.7% Scattered write-insName as filed: Writein Write-in 4020.3% - Votes for listed candidates
- 189,525
- Election day
- November 5, 1996
- District map
- Older district map (1992 to 2000)
US House, South Carolina District 3, 1996, every candidate Candidate Party Votes and share Share RepublicanLindsey O GrahamWon Republican 114,27360.3% DemocraticDebbie Dorn Democratic 73,41738.7% OtherLindal Pennington Other 1,8351.0% - Votes for listed candidates
- 150,068
- Election day
- November 8, 1994
- District map
- Older district map (1992 to 2000)
US House, South Carolina District 3, 1994, every candidate Candidate Party Votes and share Share RepublicanLindsey O GrahamWon Republican 90,12360.1% DemocraticJames E Bryan Jr Democratic 59,93239.9% Scattered write-insName as filed: Writein Write-in 130.0% - Votes for listed candidates
- 194,864
- Election day
- November 3, 1992
- District map
- Older district map (1992 to 2000)
US House, South Carolina District 3, 1992, every candidate Candidate Party Votes and share Share DemocraticButler DerrickWon Democratic 119,11961.1% RepublicanJim Bland Republican 75,66038.8% Scattered write-insName as filed: Writein Write-in 850.0% - Votes for listed candidates
- 125,050
- Election day
- November 6, 1990
- District map
- Older district map (1982 to 1990)
US House, South Carolina District 3, 1990, every candidate Candidate Party Votes and share Share DemocraticButler DerrickWon Democratic 72,56158.0% RepublicanRay Haskett Republican 52,41941.9% Scattered write-insName as filed: Writein Write-in 700.1% - Votes for listed candidates
- 165,825
- Election day
- November 8, 1988
- District map
- Older district map (1982 to 1990)
US House, South Carolina District 3, 1988, every candidate Candidate Party Votes and share Share DemocraticButler DerrickWon Democratic 89,07153.7% RepublicanHenry Jordan Republican 75,57145.6% LibertarianJohn B Heaton Libertarian 1,1830.7% - Votes for listed candidates
- 115,683
- Election day
- November 4, 1986
- District map
- Older district map (1982 to 1990)
US House, South Carolina District 3, 1986, every candidate Candidate Party Votes and share Share DemocraticButler DerrickWon Democratic 79,10968.4% RepublicanRichard Dickison Republican 36,49531.5% Scattered write-insName as filed: Writein Write-in 790.1% - Votes for listed candidates
- 152,166
- Election day
- November 6, 1984
- District map
- Older district map (1982 to 1990)
US House, South Carolina District 3, 1984, every candidate Candidate Party Votes and share Share DemocraticButler DerrickWon Democratic 88,91758.4% RepublicanClarence E Taylor Republican 61,73940.6% LibertarianRobert Madden Libertarian 1,5101.0% - Votes for listed candidates
- 85,339
- Election day
- November 2, 1982
- District map
- Older district map (1982 to 1990)
US House, South Carolina District 3, 1982, every candidate Candidate Party Votes and share Share DemocraticButler DerrickWon Democratic 77,12590.4% LibertarianGordon T Davis Libertarian 8,2149.6% - Votes for listed candidates
- 146,638
- Election day
- November 4, 1980
- District map
- Older district map (1972 to 1980)
US House, South Carolina District 3, 1980, every candidate Candidate Party Votes and share Share DemocraticButler DerrickWon Democratic 87,68059.8% RepublicanMarshall Parker Republican 57,84039.4% LibertarianBoyce Lee Muller Libertarian 1,1180.8% - Votes for listed candidates
- 98,892
- Election day
- November 7, 1978
- District map
- Older district map (1972 to 1980)
US House, South Carolina District 3, 1978, every candidate Candidate Party Votes and share Share DemocraticButler DerrickWon Democratic 80,96881.9% RepublicanAnthony Panuccio Republican 17,92418.1% - Votes for listed candidates
- 117,855
- Election day
- November 2, 1976
- District map
- Older district map (1972 to 1980)
US House, South Carolina District 3, 1976, every candidate Candidate Party Votes and share Share DemocraticButler C DerrickWon Democratic 117,74099.9% Scattered write-insName as filed: Writein Write-in 1150.1%
1976 to 2024: MIT Election Data and Science Lab, U.S. House 1976-2024, retrieved Oct 28, 2026. Compiled by MIT Election Data and Science Lab (MEDSL) from official returns; not an official source
District numbers are reused after each redistricting, so rows on older lines cover different territory than today's South Carolina District 3.
Download and cite
Cite this page
Election Wrld. (2026). South Carolina District 3, US House results. https://www.electionwrld.com/sc/congress/3. Retrieved October 30, 2026.
Embed this seat
<iframe src="https://www.electionwrld.com/embed/sc/congress/3" title="South Carolina District 3, US House" width="100%" height="400" style="border:0;max-width:640px" loading="lazy"></iframe>
<p style="font-size:13px">Data: <a href="https://www.electionwrld.com">Election Wrld</a>, CC BY 4.0</p>Sources
Sources: MIT Election Data and Science Lab, U.S. House 1976-2024 (CC0 1.0), retrieved Oct 28, 2026, compiled by MIT Election Data and Science Lab (MEDSL) from official returns, not an official source; Census TIGERweb Legislative MapServer (120th CDs layer 0, 119th CDs layer 4, 2026 SLD upper layer 1 and lower layer 2) (US Census Bureau, public domain), retrieved Oct 28, 2026; unitedstates/congress-legislators (current) (CC0-1.0), retrieved Oct 28, 2026, compiled by the @unitedstates project volunteers (rosters from official congressional sources) from official returns, not an official source.
DataState data (JSON)Sources: MIT Election Data and Science Lab, U.S. House 1976-2024, FEC, DIME (ODC-BY), Portraits: unitedstates/images (public domain)Data as of Oct 28, 2026