

Washington District 8
Tue, Nov 3 · Seat held by Kim Schrier Democratic since Jan 2019
No published poll names both candidates.Last result · 2024 general: Kim Schrier (D) 54.0, Carmen Goers (R) 45.8
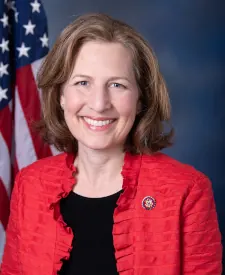
- Last election
- Kim Schrier (Democratic) won by 8.2 points, 2024
- Margin since 2022
- 1.3 points toward Democrats
- On the 2026 ballot
- 2 candidates
Side by side
Left column: MelineRight column: Schrier
- Total receipts, 2025-2026 cycle, through Oct 14
- $158K
- $3.8M
- Cash on hand
- $73K
- $3.2M
- Donor-based spectrum
- LiberalCentristConservativeSchrierNo published score for Meline
- Races
- None listed
- Won 4 of 4
- Years since first win
- Not available
- 7
- Age on Election Day
- Not available
- 58
Money: FEC bulk data, through Oct 14. One or more are matched to the FEC by name, party and seat, so a total could belong to someone else.
How these are counted
Total receipts line of each candidate’s principal campaign committee, 2025-2026 cycle. Other sites may show career, six-year or all-committee totals, which differ. Meline: $157,774 received, $72,721 cash on hand. Schrier: $3,766,607 received, $3,216,892 cash on hand. The spectrum is a published research score, not our rating. How this works. Wins and losses count the races in our results files, the same as each profile.
More about this race
Candidates on the ballot
- Kim SchrierIncumbentDemocratic
- Spencer MelineRepublican
Source: sos.wa.gov (PDF), dated Aug 21
Shift since 2022: 1.3 points toward Democrats (Democratic by 6.9 in 2022, Democratic by 8.2 in 2024).
All Washington districts
- D 15+ pts
- D 5 to 15 pts
- D under 5 pts
- R under 5 pts
- R 5 to 15 pts
- R 15+ pts
- Other winner
- No data
Show these districts as a list (10)
- Washington District 1· Suzan K. DelBene (D), Democratic by 26.3 points, 2024
- Washington District 2· Rick Larsen (D), Democratic by 27.9 points, 2024
- Washington District 3· Marie Gluesenkamp Perez (D), Democratic by 3.8 points, 2024
- Washington District 4· Dan Newhouse (R), Republican by 5.8 points, 2024
- Washington District 5· Michael Baumgartner (R), Republican by 21.3 points, 2024
- Washington District 6· Emily Randall (D), Democratic by 13.6 points, 2024
- Washington District 7· Pramila Jayapal (D), Democratic by 68.1 points, 2024
- Washington District 8· Kim Schrier (D), Democratic by 8.2 points, 2024
- Washington District 9· Adam Smith (D), Democratic by 33.0 points, 2024
- Washington District 10· Marilyn Strickland (D), Democratic by 17.3 points, 2024
Map settings
Vote in Washington
Trouble voting? Election Protection hotline: 866-OUR-VOTE. A nonpartisan coalition of civil-rights and voting-rights groups, not a government service. 866ourvote.org
Official results for Washington
History (22 elections for this seat)
- Votes for listed candidates
- 416,277
- Election day
- November 5, 2024
- District map
- Same as today
US House, Washington District 8, 2024, every candidate Candidate Party Votes and share Share DemocraticKim SchrierWon Democratic 224,60754.0% RepublicanCarmen Goers Republican 190,67545.8% Scattered write-insName as filed: Writein Write-in 9950.2% - Votes for listed candidates
- 336,038
- Election day
- November 8, 2022
- District map
- Same as today
US House, Washington District 8, 2022, every candidate Candidate Party Votes and share Share DemocraticKim SchrierWon Democratic 179,00353.3% RepublicanMatt Larkin Republican 155,97646.4% Scattered write-insName as filed: Writein Write-in 1,0590.3% - Votes for listed candidates
- 412,112
- Election day
- November 3, 2020
- District map
- Older district map (2012 to 2020)
US House, Washington District 8, 2020, every candidate Candidate Party Votes and share Share DemocraticKim SchrierWon Democratic 213,12351.7% RepublicanJesse Jensen Republican 198,42348.1% Scattered write-insName as filed: Writein Write-in 5660.1% - Votes for listed candidates
- 313,057
- Election day
- November 6, 2018
- District map
- Older district map (2012 to 2020)
US House, Washington District 8, 2018, every candidate Candidate Party Votes and share Share DemocraticKim SchrierWon Democratic 164,08952.4% RepublicanDino Rossi Republican 148,96847.6% - Votes for listed candidates
- 320,865
- Election day
- November 8, 2016
- District map
- Older district map (2012 to 2020)
US House, Washington District 8, 2016, every candidate Candidate Party Votes and share Share RepublicanDavid G ReichertWon Republican 193,14560.2% DemocraticTony Ventrella Democratic 127,72039.8% - Votes for listed candidates
- 198,744
- Election day
- November 4, 2014
- District map
- Older district map (2012 to 2020)
US House, Washington District 8, 2014, every candidate Candidate Party Votes and share Share RepublicanDavid G ReichertWon Republican 125,74163.3% DemocraticJason Ritchie Democratic 73,00336.7% - Votes for listed candidates
- 302,090
- Election day
- November 6, 2012
- District map
- Older district map (2012 to 2020)
US House, Washington District 8, 2012, every candidate Candidate Party Votes and share Share RepublicanDavid G ReichertWon Republican 180,20459.7% DemocraticKaren Porterfield Democratic 121,88640.3% - Votes for listed candidates
- 309,877
- Election day
- November 2, 2010
- District map
- Older district map (2002 to 2010)
US House, Washington District 8, 2010, every candidate Candidate Party Votes and share Share RepublicanDavid G ReichertWon Republican 161,29652.1% DemocraticSuzan DelBene Democratic 148,58147.9% - Votes for listed candidates
- 362,926
- Election day
- November 4, 2008
- District map
- Older district map (2002 to 2010)
US House, Washington District 8, 2008, every candidate Candidate Party Votes and share Share RepublicanDavid G ReichertWon Republican 191,56852.8% DemocraticDarcy Burner Democratic 171,35847.2% - Votes for listed candidates
- 251,383
- Election day
- November 7, 2006
- District map
- Older district map (2002 to 2010)
US House, Washington District 8, 2006, every candidate Candidate Party Votes and share Share RepublicanDavid G ReichertWon Republican 129,36251.5% DemocraticDarcy Burner Democratic 122,02148.5% - Votes for listed candidates
- 336,499
- Election day
- November 2, 2004
- District map
- Older district map (2002 to 2010)
US House, Washington District 8, 2004, every candidate Candidate Party Votes and share Share RepublicanDave ReichertWon Republican 173,29851.5% DemocraticDave Ross Democratic 157,14846.7% LibertarianSpencer Garrett Libertarian 6,0531.8% - Votes for listed candidates
- 203,335
- Election day
- November 5, 2002
- District map
- Older district map (2002 to 2010)
US House, Washington District 8, 2002, every candidate Candidate Party Votes and share Share RepublicanJennifer DunnWon Republican 121,63359.8% DemocraticHeidi Behrens-Benedict Democratic 75,93137.3% LibertarianMark A Taff Libertarian 5,7712.8% - Votes for listed candidates
- 294,468
- Election day
- November 7, 2000
- District map
- Older district map (1992 to 2000)
US House, Washington District 8, 2000, every candidate Candidate Party Votes and share Share RepublicanJennifer DunnWon Republican 183,25562.2% DemocraticHeidi Behrens-Benedict Democratic 104,94435.6% LibertarianBernard McIlroy Libertarian 6,2692.1% - Votes for listed candidates
- 226,910
- Election day
- November 3, 1998
- District map
- Older district map (1992 to 2000)
US House, Washington District 8, 1998, every candidate Candidate Party Votes and share Share RepublicanJennifer DunnWon Republican 135,53959.7% DemocraticHeidi Behrens-Benedict Democratic 91,37140.3% - Votes for listed candidates
- 261,031
- Election day
- November 5, 1996
- District map
- Older district map (1992 to 2000)
US House, Washington District 8, 1996, every candidate Candidate Party Votes and share Share RepublicanJennifer DunnWon Republican 170,69165.4% DemocraticDave Little Democratic 90,34034.6% - Votes for listed candidates
- 184,574
- Election day
- November 8, 1994
- District map
- Older district map (1992 to 2000)
US House, Washington District 8, 1994, every candidate Candidate Party Votes and share Share RepublicanJennifer DunnWon Republican 140,40976.1% DemocraticJim Wyrick Democratic 44,16523.9% - Votes for listed candidates
- 258,171
- Election day
- November 3, 1992
- District map
- Older district map (1992 to 2000)
US House, Washington District 8, 1992, every candidate Candidate Party Votes and share Share RepublicanJennifer DunnWon Republican 155,87460.4% DemocraticGeorge O Tamblyn Democratic 87,61133.9% IndependentBob Adams Independent 14,6865.7% - Votes for listed candidates
- 171,354
- Election day
- November 6, 1990
- District map
- Older district map (1982 to 1990)
US House, Washington District 8, 1990, every candidate Candidate Party Votes and share Share RepublicanRod ChandlerWon Republican 96,32356.2% DemocraticDavid Giles Democratic 75,03143.8% - Votes for listed candidates
- 246,862
- Election day
- November 8, 1988
- District map
- Older district map (1982 to 1990)
US House, Washington District 8, 1988, every candidate Candidate Party Votes and share Share RepublicanRod ChandlerWon Republican 174,94270.9% DemocraticJim Kean Democratic 71,92029.1% - Votes for listed candidates
- 165,369
- Election day
- November 4, 1986
- District map
- Older district map (1982 to 1990)
US House, Washington District 8, 1986, every candidate Candidate Party Votes and share Share RepublicanRod ChandlerWon Republican 107,82465.2% DemocraticDavid E Giles Democratic 57,54534.8% - Votes for listed candidates
- 235,270
- Election day
- November 6, 1984
- District map
- Older district map (1982 to 1990)
US House, Washington District 8, 1984, every candidate Candidate Party Votes and share Share RepublicanRod ChandlerWon Republican 146,89162.4% DemocraticBob Lamson Democratic 88,37937.6% - Votes for listed candidates
- 139,033
- Election day
- November 2, 1982
- District map
- Older district map (1982 to 1990)
US House, Washington District 8, 1982, every candidate Candidate Party Votes and share Share RepublicanRod ChandlerWon Republican 79,20957.0% DemocraticBeth Bland Democratic 59,82443.0%
1982 to 2024: MIT Election Data and Science Lab, U.S. House 1976-2024, retrieved Oct 28, 2026. Compiled by MIT Election Data and Science Lab (MEDSL) from official returns; not an official source
District numbers are reused after each redistricting, so rows on older lines cover different territory than today's Washington District 8.
Download and cite
Cite this page
Election Wrld. (2026). Washington District 8, US House results. https://www.electionwrld.com/wa/congress/8. Retrieved October 30, 2026.
Embed this seat
<iframe src="https://www.electionwrld.com/embed/wa/congress/8" title="Washington District 8, US House" width="100%" height="400" style="border:0;max-width:640px" loading="lazy"></iframe>
<p style="font-size:13px">Data: <a href="https://www.electionwrld.com">Election Wrld</a>, CC BY 4.0</p>Sources
Sources: MIT Election Data and Science Lab, U.S. House 1976-2024 (CC0 1.0), retrieved Oct 28, 2026, compiled by MIT Election Data and Science Lab (MEDSL) from official returns, not an official source; Census TIGERweb Legislative MapServer (120th CDs layer 0, 119th CDs layer 4, 2026 SLD upper layer 1 and lower layer 2) (US Census Bureau, public domain), retrieved Oct 28, 2026; unitedstates/congress-legislators (current) (CC0-1.0), retrieved Oct 28, 2026, compiled by the @unitedstates project volunteers (rosters from official congressional sources) from official returns, not an official source.
DataState data (JSON)Sources: MIT Election Data and Science Lab, U.S. House 1976-2024, FEC, DIME (ODC-BY), Portraits: unitedstates/images (public domain)Data as of Oct 28, 2026