

Alabama District 7
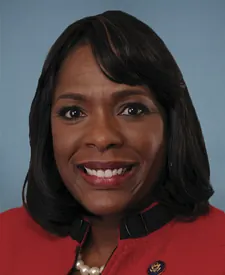
Tue, Nov 3 · Sitting member, elected on the old lines Terri A. Sewell Democratic since Jan 2011
No published poll names both candidates.District lines changed for 2026. Results from the old lines aren't shown.
- Lines for 2026
- Redrawn. 7.3% of residents were in a different district in 2024
- On the 2026 ballot
- 2 candidates
Side by side
Akin left, Sewell right- Total receipts, 2025-2026 cycle, through Oct 14
- $270K
- $2.3M
- Cash on hand
- $34K
- $3.4M
- Donor-based spectrum
- LiberalCentristConservativeSewellNo published score for Akin
- Record
- None on file
- 8-0
- Years in politics
- Not available
- 15
- Age on Election Day
- Not available
- 61
Ammie Akin on fec.gov. Terri A. Sewell on fec.gov. One or more are matched to the FEC by name, party and seat, so a total could belong to someone else.
How these are counted
Total receipts line of each candidate’s principal campaign committee, 2025-2026 cycle. Other sites may show career, six-year or all-committee totals, which differ. The spectrum is a published research score, not our rating. How this works. Record is wins and losses in the races in our results files, the same count as each profile.
More about this race
Candidates on the ballot
- Terri A. SewellIncumbentDemocratic
- Ammie AkinRepublican
This list may not include every candidate. See the official list at the Alabama Secretary of State, Elections Division
Source: sos.alabama.gov (PDF), dated Aug 26
All Alabama districts
- D 15+ pts
- D 5 to 15 pts
- D under 5 pts
- R under 5 pts
- R 5 to 15 pts
- R 15+ pts
- Other winner
- No data
Show these districts as a list (7)
- Alabama District 1· New lines for 2026, old result not shown
- Alabama District 2· New lines for 2026, old result not shown
- Alabama District 3· Mike Rogers (R), unopposed, 2024
- Alabama District 4· Robert B. Aderholt (R), unopposed, 2024
- Alabama District 5· Dale W. Strong (R), unopposed, 2024
- Alabama District 6· New lines for 2026, old result not shown
- Alabama District 7· New lines for 2026, old result not shown
Map settings
Vote in Alabama
Trouble voting? Election Protection hotline: 866-OUR-VOTE. A nonpartisan coalition of civil-rights and voting-rights groups, not a government service. 866ourvote.org
History (25 elections for this seat)
- Votes for listed candidates
- 293,220
- Election day
- November 5, 2024
- District map
- Older district map (2022 to 2025)
US House, Alabama District 7, 2024, every candidate Candidate Party Votes and share Share DemocraticTerri A. SewellWon Democratic 186,72363.7% RepublicanRobin Litaker Republican 106,31236.3% Scattered write-insName as filed: Writein Write-in 1850.1% - Votes for listed candidates
- 193,940
- Election day
- November 8, 2022
- District map
- Older district map (2022 to 2025)
US House, Alabama District 7, 2022, every candidate Candidate Party Votes and share Share DemocraticTerri A. SewellWon Democratic 123,23363.5% RepublicanBeatrice Nichols Republican 67,41634.8% LibertarianGavin Goodman Libertarian 3,2121.7% Scattered write-insName as filed: Writein Write-in 790.0% - Votes for listed candidates
- 232,331
- Election day
- November 3, 2020
- District map
- Older district map (2012 to 2020)
US House, Alabama District 7, 2020, every candidate Candidate Party Votes and share Share DemocraticTerri A. SewellWon Democratic 225,74297.2% Scattered write-insName as filed: Writein Write-in 6,5892.8% - Votes for listed candidates
- 189,163
- Election day
- November 6, 2018
- District map
- Older district map (2012 to 2020)
US House, Alabama District 7, 2018, every candidate Candidate Party Votes and share Share DemocraticTerri A. SewellWon Democratic 185,01097.8% Scattered write-insName as filed: Writein Write-in 4,1532.2% - Votes for listed candidates
- 233,028
- Election day
- November 8, 2016
- District map
- Older district map (2012 to 2020)
US House, Alabama District 7, 2016, every candidate Candidate Party Votes and share Share DemocraticTerri A. SewellWon Democratic 229,33098.4% Scattered write-insName as filed: Writein Write-in 3,6981.6% - Votes for listed candidates
- 135,899
- Election day
- November 4, 2014
- District map
- Older district map (2012 to 2020)
US House, Alabama District 7, 2014, every candidate Candidate Party Votes and share Share DemocraticTerri A. SewellWon Democratic 133,68798.4% Scattered write-insName as filed: Writein Write-in 2,2121.6% - Votes for listed candidates
- 306,558
- Election day
- November 6, 2012
- District map
- Older district map (2012 to 2020)
US House, Alabama District 7, 2012, every candidate Candidate Party Votes and share Share DemocraticTerri A. SewellWon Democratic 232,52075.8% RepublicanDon Chamberlain Republican 73,83524.1% Scattered write-insName as filed: Writein Write-in 2030.1% - Votes for listed candidates
- 188,724
- Election day
- November 2, 2010
- District map
- Older district map (2002 to 2010)
US House, Alabama District 7, 2010, every candidate Candidate Party Votes and share Share DemocraticTerri A. SewellWon Democratic 136,69672.4% RepublicanDon Chamberlain Republican 51,89027.5% Scattered write-insName as filed: Writein Write-in 1380.1% - Votes for listed candidates
- 231,701
- Election day
- November 4, 2008
- District map
- Older district map (2002 to 2010)
US House, Alabama District 7, 2008, every candidate Candidate Party Votes and share Share DemocraticArtur DavisWon Democratic 228,51898.6% Scattered write-insName as filed: Writein Write-in 3,1831.4% - Votes for listed candidates
- 135,164
- Election day
- November 7, 2006
- District map
- Older district map (2002 to 2010)
US House, Alabama District 7, 2006, every candidate Candidate Party Votes and share Share DemocraticArtur DavisWon Democratic 133,87099.0% Scattered write-insName as filed: Writein Write-in 1,2941.0% - Votes for listed candidates
- 244,638
- Election day
- November 2, 2004
- District map
- Older district map (2002 to 2010)
US House, Alabama District 7, 2004, every candidate Candidate Party Votes and share Share DemocraticArtur DavisWon Democratic 183,40875.0% RepublicanSteve F Cameron Republican 61,01924.9% Scattered write-insName as filed: Writein Write-in 2110.1% - Votes for listed candidates
- 166,309
- Election day
- November 5, 2002
- District map
- Older district map (2002 to 2010)
US House, Alabama District 7, 2002, every candidate Candidate Party Votes and share Share DemocraticArtur DavisWon Democratic 153,73592.4% LibertarianLauren Orth McCay Libertarian 12,1007.3% Scattered write-insName as filed: Writein Write-in 4740.3% - Votes for listed candidates
- 198,633
- Election day
- November 7, 2000
- District map
- Older district map (1992 to 2000)
US House, Alabama District 7, 2000, every candidate Candidate Party Votes and share Share DemocraticEarl F HilliardWon Democratic 148,24374.6% RepublicanEd Martin Republican 46,13423.2% LibertarianKen Hager Libertarian 3,8291.9% Scattered write-insName as filed: Writein Write-in 4270.2% - Votes for listed candidates
- 139,181
- Election day
- November 3, 1998
- District map
- Older district map (1992 to 2000)
US House, Alabama District 7, 1998, every candidate Candidate Party Votes and share Share DemocraticEarl F HilliardWon Democratic 136,43198.0% Scattered write-insName as filed: Writein Write-in 2,7502.0% - Votes for listed candidates
- 192,113
- Election day
- November 5, 1996
- District map
- Older district map (1992 to 2000)
US House, Alabama District 7, 1996, every candidate Candidate Party Votes and share Share DemocraticEarl F HilliardWon Democratic 136,65171.1% RepublicanJoe Powell Republican 52,14227.1% LibertarianKen Hager Libertarian 3,1571.6% Scattered write-insName as filed: Writein Write-in 1630.1% - Votes for listed candidates
- 151,117
- Election day
- November 8, 1994
- District map
- Older district map (1992 to 2000)
US House, Alabama District 7, 1994, every candidate Candidate Party Votes and share Share DemocraticEarl F HilliardWon Democratic 116,15076.9% RepublicanAlfred J Middleton Sr Republican 34,81423.0% Scattered write-insName as filed: Writein Write-in 1530.1% - Votes for listed candidates
- 207,773
- Election day
- November 3, 1992
- District map
- Older district map (1992 to 2000)
US House, Alabama District 7, 1992, every candidate Candidate Party Votes and share Share DemocraticEarl F HilliardWon Democratic 144,32069.5% RepublicanKervin Jones Republican 36,08617.4% IndependentJames M Lewis Independent 12,4616.0% IndependentJames Chambliss Independent 11,4665.5% LibertarianMichael Todd Mayer Libertarian 2,1351.0% OtherJohn Hawkins Other 1,1650.6% Scattered write-insName as filed: Writein Write-in 1400.1% - Votes for listed candidates
- 180,794
- Election day
- November 6, 1990
- District map
- Older district map (1982 to 1990)
US House, Alabama District 7, 1990, every candidate Candidate Party Votes and share Share DemocraticClaude HarrisWon Democratic 127,49070.5% RepublicanMichael D Barker Republican 53,25829.5% Scattered write-insName as filed: Writein Write-in 460.0% - Votes for listed candidates
- 200,966
- Election day
- November 8, 1988
- District map
- Older district map (1982 to 1990)
US House, Alabama District 7, 1988, every candidate Candidate Party Votes and share Share DemocraticClaude HarrisWon Democratic 136,07467.7% RepublicanJames E "Jim" Bacon Republican 63,37231.5% LibertarianAlan Barksdale Libertarian 1,4210.7% Scattered write-insName as filed: Writein Write-in 990.0% - Votes for listed candidates
- 180,903
- Election day
- November 4, 1986
- District map
- Older district map (1982 to 1990)
US House, Alabama District 7, 1986, every candidate Candidate Party Votes and share Share DemocraticClaude HarrisWon Democratic 108,12659.8% RepublicanBill McFarland Republican 72,77740.2% - Votes for listed candidates
- 140,332
- Election day
- November 6, 1984
- District map
- Older district map (1982 to 1990)
US House, Alabama District 7, 1984, every candidate Candidate Party Votes and share Share DemocraticRichard ShelbyWon Democratic 135,83496.8% LibertarianCharles "Chuck" Ewing Libertarian 4,4983.2% - Votes for listed candidates
- 128,139
- Election day
- November 2, 1982
- District map
- Older district map (1982 to 1990)
US House, Alabama District 7, 1982, every candidate Candidate Party Votes and share Share DemocraticRichard C ShelbyWon Democratic 124,07096.8% LibertarianJames Jones Libertarian 4,0583.2% Scattered write-insName as filed: Writein Write-in 110.0% - Votes for listed candidates
- 168,804
- Election day
- November 4, 1980
- District map
- Older district map (1972 to 1980)
US House, Alabama District 7, 1980, every candidate Candidate Party Votes and share Share DemocraticRichard C ShelbyWon Democratic 122,50572.6% RepublicanJames E "Jim" Bacon Republican 43,32025.7% LibertarianJoe Walker Libertarian 2,1321.3% OtherMrs Mary Owensby Other 8470.5% - Votes for listed candidates
- 82,868
- Election day
- November 7, 1978
- District map
- Older district map (1972 to 1980)
US House, Alabama District 7, 1978, every candidate Candidate Party Votes and share Share DemocraticRichard C ShelbyWon Democratic 77,74293.8% OtherFulton Gray Other 3,2854.0% RepublicanJim Scruggs Republican 1,8412.2% - Votes for listed candidates
- 110,501
- Election day
- November 2, 1976
- District map
- Older district map (1972 to 1980)
US House, Alabama District 7, 1976, every candidate Candidate Party Votes and share Share DemocraticWalter FlowersWon Democratic 110,496100.0% Scattered write-insName as filed: Writein Write-in 50.0%
All rows: MIT Election Data and Science Lab, U.S. House 1976-2024, retrieved Oct 28, 2026
Alabama District 7 was redrawn for 2026, so every row here ran on older lines and covers different territory. The map in force, by state
Download and cite
Cite this page
Election Wrld. (2026). Alabama District 7, US House results. https://www.electionwrld.com/al/congress/7. Retrieved October 30, 2026.
Embed this seat
<iframe src="https://www.electionwrld.com/embed/al/congress/7" title="Alabama District 7, US House" width="100%" height="400" style="border:0;max-width:640px" loading="lazy"></iframe>
<p style="font-size:13px">Data: <a href="https://www.electionwrld.com">Election Wrld</a>, CC BY 4.0</p>Sources
Sources
- Used for
- web/data/results/house/{ST}.json. The Dataverse API refuses this file behind a guestbook, so the identical file was taken from two public GitHub copies (Hackquantumcpp/snoutcounter-midterms-2026-model data/1976-2024-house.csv and sta199-f26/sta199-f26.github.io _data/gerrymander/1976-2024-house.tab), which are byte-identical to each other and match the md5 a9566ac393913a1af343284e837c17bb that Dataverse lists for dataset version 15.0 (2026-03-09). sha256 76eec42483ee9f0fc5cf6e377442c783d1ae6eefa929729fd6561a69bab47f2a.
- License
- CC0 1.0
- Retrieved
- October 28, 2026
- Link
- https://doi.org/10.7910/DVN/IG0UN2
- Used for
- cd.topo.json, sld/*.topo.json
- License
- US Census Bureau, public domain
- Retrieved
- October 28, 2026
- Link
- https://tigerweb.geo.census.gov/arcgis/rest/services/TIGERweb/Legislative/MapServer
- Used for
- web/data/officials/congress.json (name, party, bioguide, official site, service start) and web/data/people (birth year, committees, social media handles and profile links; links only, nothing copied from the platforms). As-of: the files saved in data/raw/people on 2026-10-29.
- License
- CC0-1.0
- Retrieved
- October 28, 2026
- Link
- https://unitedstates.github.io/congress-legislators/legislators-current.json
DataState data (JSON)Sources: MIT Election Data and Science Lab, U.S. House 1976-2024, FEC, DIME (ODC-BY), Portraits: unitedstates/images (public domain)Data as of Oct 28, 2026