

New York District 1
Tue, Nov 3 · Seat held by Nick LaLota Republican since Jan 2023
Gallant 38 · LaLota 41No polls in the last 7 weeksNewest poll · Public Policy Polling, field dates Dec 10 to Dec 11, released Apr 27, 579 adults, partisan (D), per VoteHubPoll sponsored by House Majority PACPolls updated Oct 31, 4:06 a.m. ET, from VoteHub
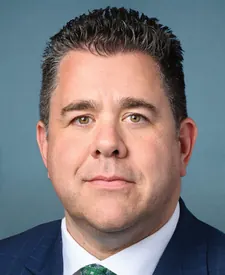
- Last election
- Nick LaLota (Republican) won by 10.4 points, 2024
- Since 2022
- District lines changed, so no comparison
- On the 2026 ballot
- 2 candidates
Polls over time
One published poll names these candidates: Public Policy Polling, Dec 10 to Dec 11, released Apr 27. All 1 on the polls page. Polls updated Oct 31, 4:06 a.m. ET, from VoteHub.
Side by side
Left column: GallantRight column: LaLota
- Total receipts, 2025-2026 cycle, through Oct 14
- $1.7M
- $4.5M
- Cash on hand
- $426K
- $2.3M
- Donor-based spectrum
- LiberalCentristConservativeLaLotaNo published score for Gallant
- Races
- None listed
- Won 2 of 2
- Years since first win
- Not available
- 3
- Age on Election Day
- Not available
- 48
Money: FEC bulk data, through Oct 14. One or more are matched to the FEC by name, party and seat, so a total could belong to someone else.
How these are counted
Total receipts line of each candidate’s principal campaign committee, 2025-2026 cycle. Other sites may show career, six-year or all-committee totals, which differ. Gallant: $1,735,638 received, $425,993 cash on hand. LaLota: $4,486,089 received, $2,314,993 cash on hand. The spectrum is a published research score, not our rating. How this works. Wins and losses count the races in our results files, the same as each profile.
More about this race
Candidates on the ballot
- Christopher J. GallantDemocratic
- Nick LaLotaIncumbentRepublican(Republican, Conservative)
Source: elections.ny.gov, dated Oct 7
Shift since 2022: lines changed, no comparison.
All New York districts
- D 15+ pts
- D 5 to 15 pts
- D under 5 pts
- R under 5 pts
- R 5 to 15 pts
- R 15+ pts
- Other winner
- No data
Show these districts as a list (26)
- New York District 1· Nick LaLota (R), Republican by 10.4 points, 2024
- New York District 2· Andrew R. Garbarino (R), Republican by 19.5 points, 2024
- New York District 3· Thomas R. Suozzi (D), Democratic by 3.6 points, 2024
- New York District 4· Laura Gillen (D), Democratic by 2.3 points, 2024
- New York District 5· Gregory W. Meeks (D), Democratic by 45.7 points, 2024
- New York District 6· Grace Meng (D), Democratic by 23.0 points, 2024
- New York District 7· Nydia M. Velázquez (D), Democratic by 56.1 points, 2024
- New York District 8· Hakeem S. Jeffries (D), Democratic by 50.6 points, 2024
- New York District 9· Yvette D. Clarke (D), Democratic by 48.0 points, 2024
- New York District 10· Daniel S. Goldman (D), Democratic by 66.2 points, 2024
- New York District 11· Nicole Malliotakis (R), Republican by 28.0 points, 2024
- New York District 12· Jerrold Nadler (D), Democratic by 60.9 points, 2024
- New York District 13· Adriano Espaillat (D), Democratic by 66.6 points, 2024
- New York District 14· Alexandria Ocasio-Cortez (D), Democratic by 38.2 points, 2024
- New York District 15· Ritchie Torres (D), Democratic by 55.2 points, 2024
- New York District 16· George Latimer (D), Democratic by 43.0 points, 2024
- New York District 17· Michael Lawler (R), Republican by 6.3 points, 2024
- New York District 18· Patrick Ryan (D), Democratic by 14.3 points, 2024
- New York District 19· Josh Riley (D), Democratic by 2.3 points, 2024
- New York District 20· Paul Tonko (D), Democratic by 22.3 points, 2024
- New York District 21· Elise M. Stefanik (R), Republican by 24.0 points, 2024
- New York District 22· John W. Mannion (D), Democratic by 9.1 points, 2024
- New York District 23· Nicholas A. Langworthy (R), Republican by 31.6 points, 2024
- New York District 24· Claudia Tenney (R), Republican by 31.3 points, 2024
- New York District 25· Joseph D. Morelle (D), Democratic by 21.6 points, 2024
- New York District 26· Timothy M. Kennedy (D), Democratic by 30.3 points, 2024
Map settings
Vote in New York
Trouble voting? Election Protection hotline: 866-OUR-VOTE. A nonpartisan coalition of civil-rights and voting-rights groups, not a government service. 866ourvote.org
History (25 elections for this seat)
- Votes for listed candidates
- 410,100
- Election day
- November 5, 2024
- District map
- Same as today
US House, New York District 1, 2024, every candidate Candidate Party Votes and share Share RepublicanNick LaLotaWon Republican 226,28555.2% DemocraticJohn P. Avlon Democratic 183,54044.8% Scattered write-insName as filed: Scattering Write-in 2750.1% - Votes for listed candidates
- 318,995
- Election day
- November 8, 2022
- District map
- Same as today
US House, New York District 1, 2022, every candidate Candidate Party Votes and share Share RepublicanNick LaLotaWonName as filed: Nicholas J Lalota Republican 177,04055.5% DemocraticBridget Fleming Democratic 141,90744.5% Scattered write-insName as filed: Scattering Write-in 480.0% - Votes for listed candidates
- 375,116
- Election day
- November 3, 2020
- District map
- Older district map (2012 to 2020)
US House, New York District 1, 2020, every candidate Candidate Party Votes and share Share RepublicanLee M ZeldinWon Republican 205,71554.8% DemocraticNancy S Goroff Democratic 169,29445.1% Scattered write-insName as filed: Writein Write-in 1070.0% - Votes for listed candidates
- 270,053
- Election day
- November 6, 2018
- District map
- Older district map (2012 to 2020)
US House, New York District 1, 2018, every candidate Candidate Party Votes and share Share RepublicanLee M ZeldinWon Republican 139,02751.5% DemocraticPerry Gershon Democratic 127,99147.4% OtherKate M Browning Other 2,9881.1% Scattered write-insName as filed: Writein Write-in 470.0% - Votes for listed candidates
- 323,890
- Election day
- November 8, 2016
- District map
- Older district map (2012 to 2020)
US House, New York District 1, 2016, every candidate Candidate Party Votes and share Share RepublicanLee M ZeldinWon Republican 188,49958.2% DemocraticAnna E Throne-Holst Democratic 135,27841.8% Scattered write-insName as filed: Writein Write-in 1130.0% - Votes for listed candidates
- 172,757
- Election day
- November 4, 2014
- District map
- Older district map (2012 to 2020)
US House, New York District 1, 2014, every candidate Candidate Party Votes and share Share RepublicanLee M ZeldinWon Republican 94,03554.4% DemocraticTimothy H Bishop Democratic 78,72245.6% - Votes for listed candidates
- 276,848
- Election day
- November 6, 2012
- District map
- Older district map (2012 to 2020)
US House, New York District 1, 2012, every candidate Candidate Party Votes and share Share DemocraticTimothy H BishopWon Democratic 145,19852.4% RepublicanRandy Altschuler Republican 131,65047.6% - Votes for listed candidates
- 196,039
- Election day
- November 2, 2010
- District map
- Older district map (2002 to 2010)
US House, New York District 1, 2010, every candidate Candidate Party Votes and share Share DemocraticTimothy H BishopWon Democratic 98,31650.2% RepublicanRandy Altschuler Republican 97,72349.8% - Votes for listed candidates
- 277,628
- Election day
- November 4, 2008
- District map
- Older district map (2002 to 2010)
US House, New York District 1, 2008, every candidate Candidate Party Votes and share Share DemocraticTimothy H BishopWon Democratic 162,08358.4% RepublicanLee M Zeldin Republican 115,54541.6% - Votes for listed candidates
- 167,688
- Election day
- November 7, 2006
- District map
- Older district map (2002 to 2010)
US House, New York District 1, 2006, every candidate Candidate Party Votes and share Share DemocraticTimothy H BishopWon Democratic 104,36062.2% RepublicanItalo A Zanzi Republican 63,32837.8% - Votes for listed candidates
- 278,209
- Election day
- November 2, 2004
- District map
- Older district map (2002 to 2010)
US House, New York District 1, 2004, every candidate Candidate Party Votes and share Share DemocraticTimothy H BishopWon Democratic 156,35456.2% RepublicanWilliam M Manger Jr Republican 121,85543.8% - Votes for listed candidates
- 167,791
- Election day
- November 5, 2002
- District map
- Older district map (2002 to 2010)
US House, New York District 1, 2002, every candidate Candidate Party Votes and share Share DemocraticTimothy H BishopWon Democratic 84,27650.2% RepublicanFelix J Grucci Jr Republican 81,52448.6% GreenLorna Salzman Green 1,9911.2% - Votes for listed candidates
- 239,604
- Election day
- November 7, 2000
- District map
- Older district map (1992 to 2000)
US House, New York District 1, 2000, every candidate Candidate Party Votes and share Share RepublicanFelix J Grucci JrWon Republican 133,02055.5% DemocraticRegina Seltzer Democratic 97,29940.6% OtherMichael P Forbes Other 6,3182.6% GreenWilliam G Holst Green 2,9671.2% - Votes for listed candidates
- 155,090
- Election day
- November 3, 1998
- District map
- Older district map (1992 to 2000)
US House, New York District 1, 1998, every candidate Candidate Party Votes and share Share RepublicanMichael P ForbesWon Republican 99,46064.1% DemocraticWilliam G Holst Democratic 55,63035.9% - Votes for listed candidates
- 213,116
- Election day
- November 5, 1996
- District map
- Older district map (1992 to 2000)
US House, New York District 1, 1996, every candidate Candidate Party Votes and share Share RepublicanMichael P ForbesWon Republican 116,62054.7% DemocraticNora L Bredes Democratic 96,49645.3% - Votes for listed candidates
- 184,033
- Election day
- November 8, 1994
- District map
- Older district map (1992 to 2000)
US House, New York District 1, 1994, every candidate Candidate Party Votes and share Share RepublicanMichael P ForbesWon Republican 90,49149.2% DemocraticGeorge J Hochbrueckner Democratic 80,14643.5% Scattered write-insName as filed: Writein Write-in 11,7936.4% OtherMichael Strong Other 1,6030.9% - Votes for listed candidates
- 227,983
- Election day
- November 3, 1992
- District map
- Older district map (1992 to 2000)
US House, New York District 1, 1992, every candidate Candidate Party Votes and share Share DemocraticGeorge J HochbruecknerWon Democratic 117,94051.7% RepublicanEdward P Romaine Republican 110,04348.3% - Votes for listed candidates
- 143,180
- Election day
- November 6, 1990
- District map
- Older district map (1982 to 1990)
US House, New York District 1, 1990, every candidate Candidate Party Votes and share Share DemocraticGeorge J HochbruecknerWon Democratic 75,21152.5% RepublicanFrancis W Creighton Republican 46,38032.4% Scattered write-insName as filed: Writein Write-in 9,5956.7% OtherClayton Baldwin Jr Other 6,8834.8% OtherPeter J O'Hara Other 5,1113.6% - Votes for listed candidates
- 207,951
- Election day
- November 8, 1988
- District map
- Older district map (1982 to 1990)
US House, New York District 1, 1988, every candidate Candidate Party Votes and share Share DemocraticGeorge J HochbruecknerWon Democratic 105,62450.8% RepublicanEdwaes P Romaine Republican 102,32749.2% - Votes for listed candidates
- 131,031
- Election day
- November 4, 1986
- District map
- Older district map (1982 to 1990)
US House, New York District 1, 1986, every candidate Candidate Party Votes and share Share DemocraticGeorge J HochbruecknerWon Democratic 67,13951.2% RepublicanGregory J Blass Republican 55,41342.3% OtherDominic J Santoro Other 4,3453.3% OtherWilliam J Doyle Other 4,1343.2% - Votes for listed candidates
- 201,580
- Election day
- November 6, 1984
- District map
- Older district map (1982 to 1990)
US House, New York District 1, 1984, every candidate Candidate Party Votes and share Share RepublicanWilliam CarneyWon Republican 107,02953.1% DemocraticGeorge J Hochbrueckner Democratic 94,55146.9% - Votes for listed candidates
- 138,021
- Election day
- November 2, 1982
- District map
- Older district map (1982 to 1990)
US House, New York District 1, 1982, every candidate Candidate Party Votes and share Share RepublicanWilliam CarneyWon Republican 88,23463.9% DemocraticEthan C Eldon Democratic 49,78736.1% - Votes for listed candidates
- 204,486
- Election day
- November 4, 1980
- District map
- Older district map (1972 to 1980)
US House, New York District 1, 1980, every candidate Candidate Party Votes and share Share RepublicanWilliam CarneyWon Republican 115,21356.3% DemocraticThomas A Twomey Democratic 85,62941.9% OtherRichard M Cummings Other 3,6441.8% - Votes for listed candidates
- 160,204
- Election day
- November 7, 1978
- District map
- Older district map (1972 to 1980)
US House, New York District 1, 1978, every candidate Candidate Party Votes and share Share RepublicanWilliam CarneyWon Republican 90,11556.3% DemocraticJohn Randolph Democratic 67,18041.9% OtherDorothy A Samek Other 2,9091.8% - Votes for listed candidates
- 207,468
- Election day
- November 2, 1976
- District map
- Older district map (1972 to 1980)
US House, New York District 1, 1976, every candidate Candidate Party Votes and share Share DemocraticOtis G PikeWon Democratic 135,52865.3% RepublicanSalvatore Nicosia Republican 61,67129.7% OtherSeth C Morgan Other 10,2694.9%
1976 to 2024: MIT Election Data and Science Lab, U.S. House 1976-2024, retrieved Oct 28, 2026. Compiled by MIT Election Data and Science Lab (MEDSL) from official returns; not an official source
District numbers are reused after each redistricting, so rows on older lines cover different territory than today's New York District 1.
Download and cite
Cite this page
Election Wrld. (2026). New York District 1, US House results. https://www.electionwrld.com/ny/congress/1. Retrieved October 31, 2026.
Embed this seat
<iframe src="https://www.electionwrld.com/embed/ny/congress/1" title="New York District 1, US House" width="100%" height="400" style="border:0;max-width:640px" loading="lazy"></iframe>
<p style="font-size:13px">Data: <a href="https://www.electionwrld.com">Election Wrld</a>, CC BY 4.0</p>Sources
Sources: MIT Election Data and Science Lab, U.S. House 1976-2024 (CC0 1.0), retrieved Oct 28, 2026, compiled by MIT Election Data and Science Lab (MEDSL) from official returns, not an official source; Census TIGERweb Legislative MapServer (120th CDs layer 0, 119th CDs layer 4, 2026 SLD upper layer 1 and lower layer 2) (US Census Bureau, public domain), retrieved Oct 28, 2026; unitedstates/congress-legislators (current) (CC0-1.0), retrieved Oct 28, 2026, compiled by the @unitedstates project volunteers (rosters from official congressional sources) from official returns, not an official source.
DataState data (JSON)Sources: MIT Election Data and Science Lab, U.S. House 1976-2024, VoteHub polls (CC BY 4.0), FEC, DIME (ODC-BY), Portraits: unitedstates/images (public domain)Data as of Oct 30, 2026 (candidate list Oct 28, 2026)