

New York District 11
Tue, Nov 3 · Seat held by Nicole Malliotakis Republican since Jan 2021
No published poll names both candidates.Last result · 2024 general: Nicole Malliotakis (R) 63.8, Andrea S. Morse (D) 35.8
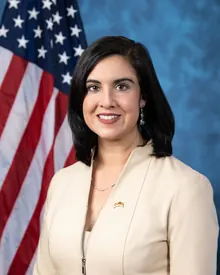
- Last election
- Nicole Malliotakis (Republican) won by 28.0 points, 2024
- Margin since 2022
- 4.5 points toward Republicans
- On the 2026 ballot
- 2 candidates
Side by side
DeCillis left, Malliotakis right- Total receipts, 2025-2026 cycle, through Oct 14
- $183K
- $3.3M
- Cash on hand
- $108K
- $2.8M
- Donor-based spectrum
- LiberalCentristConservativeMalliotakisNo published score for DeCillis
- Record
- None on file
- 8-0
- Years in politics
- Not available
- 5
- Age on Election Day
- Not available
- 45
Mike DeCillis on fec.gov. Nicole Malliotakis on fec.gov. One or more are matched to the FEC by name, party and seat, so a total could belong to someone else.
How these are counted
Total receipts line of each candidate’s principal campaign committee, 2025-2026 cycle. Other sites may show career, six-year or all-committee totals, which differ. The spectrum is a published research score, not our rating. How this works. Record is wins and losses in the races in our results files, the same count as each profile.
More about this race
Candidates on the ballot
- Mike DeCillisDemocratic
- Nicole MalliotakisIncumbentRepublican(Republican, Conservative)
Source: elections.ny.gov, dated Oct 7
Shift since 2022: 4.5 points toward Republicans (Republican by 23.5 in 2022, Republican by 28.0 in 2024).
All New York districts
- D 15+ pts
- D 5 to 15 pts
- D under 5 pts
- R under 5 pts
- R 5 to 15 pts
- R 15+ pts
- Other winner
- No data
Show these districts as a list (26)
- New York District 1· Nick LaLota (R), Republican by 10.4 points, 2024
- New York District 2· Andrew R. Garbarino (R), Republican by 19.5 points, 2024
- New York District 3· Thomas R. Suozzi (D), Democratic by 3.6 points, 2024
- New York District 4· Laura Gillen (D), Democratic by 2.3 points, 2024
- New York District 5· Gregory W. Meeks (D), Democratic by 45.7 points, 2024
- New York District 6· Grace Meng (D), Democratic by 23.0 points, 2024
- New York District 7· Nydia M. Velázquez (D), Democratic by 56.1 points, 2024
- New York District 8· Hakeem S. Jeffries (D), Democratic by 50.6 points, 2024
- New York District 9· Yvette D. Clarke (D), Democratic by 48.0 points, 2024
- New York District 10· Daniel S. Goldman (D), Democratic by 66.2 points, 2024
- New York District 11· Nicole Malliotakis (R), Republican by 28.0 points, 2024
- New York District 12· Jerrold Nadler (D), Democratic by 60.9 points, 2024
- New York District 13· Adriano Espaillat (D), Democratic by 66.6 points, 2024
- New York District 14· Alexandria Ocasio-Cortez (D), Democratic by 38.2 points, 2024
- New York District 15· Ritchie Torres (D), Democratic by 55.2 points, 2024
- New York District 16· George Latimer (D), Democratic by 43.0 points, 2024
- New York District 17· Michael Lawler (R), Republican by 6.3 points, 2024
- New York District 18· Patrick Ryan (D), Democratic by 14.3 points, 2024
- New York District 19· Josh Riley (D), Democratic by 2.3 points, 2024
- New York District 20· Paul Tonko (D), Democratic by 22.3 points, 2024
- New York District 21· Elise M. Stefanik (R), Republican by 24.0 points, 2024
- New York District 22· John W. Mannion (D), Democratic by 9.1 points, 2024
- New York District 23· Nicholas A. Langworthy (R), Republican by 31.6 points, 2024
- New York District 24· Claudia Tenney (R), Republican by 31.3 points, 2024
- New York District 25· Joseph D. Morelle (D), Democratic by 21.6 points, 2024
- New York District 26· Timothy M. Kennedy (D), Democratic by 30.3 points, 2024
Map settings
Vote in New York
Trouble voting? Election Protection hotline: 866-OUR-VOTE. A nonpartisan coalition of civil-rights and voting-rights groups, not a government service. 866ourvote.org
History (25 elections for this seat)
- Votes for listed candidates
- 261,728
- Election day
- November 5, 2024
- District map
- Same as today
US House, New York District 11, 2024, every candidate Candidate Party Votes and share Share RepublicanNicole MalliotakisWon Republican 167,09963.8% DemocraticAndrea S. Morse Democratic 93,58635.8% Scattered write-insName as filed: Scattering Write-in 1,0430.4% - Votes for listed candidates
- 188,099
- Election day
- November 8, 2022
- District map
- Same as today
US House, New York District 11, 2022, every candidate Candidate Party Votes and share Share RepublicanNicole MalliotakisWon Republican 115,99261.7% DemocraticMax N Rose Democratic 71,80138.2% Scattered write-insName as filed: Scattering Write-in 3060.2% - Votes for listed candidates
- 293,314
- Election day
- November 3, 2020
- District map
- Older district map (2012 to 2020)
US House, New York District 11, 2020, every candidate Candidate Party Votes and share Share RepublicanNicole MalliotakisWon Republican 155,60853.1% DemocraticMax N Rose Democratic 137,19846.8% Scattered write-insName as filed: Writein Write-in 5080.2% - Votes for listed candidates
- 192,173
- Election day
- November 6, 2018
- District map
- Older district map (2012 to 2020)
US House, New York District 11, 2018, every candidate Candidate Party Votes and share Share DemocraticMax N RoseWon Democratic 101,82353.0% RepublicanDan Donovan Republican 89,44146.5% GreenHenry J Bardel Green 7740.4% Scattered write-insName as filed: Writein Write-in 1350.1% - Votes for listed candidates
- 232,317
- Election day
- November 8, 2016
- District map
- Older district map (2012 to 2020)
US House, New York District 11, 2016, every candidate Candidate Party Votes and share Share RepublicanDaniel M Donovan JrWon Republican 142,93461.5% DemocraticRichard A Reichard Democratic 85,25736.7% GreenHenry J Bardel Green 3,9061.7% Scattered write-insName as filed: Writein Write-in 2200.1% - Votes for listed candidates
- 106,817
- Election day
- November 4, 2014
- District map
- Older district map (2012 to 2020)
US House, New York District 11, 2014, every candidate Candidate Party Votes and share Share RepublicanMichael G GrimmWon Republican 58,88655.1% DemocraticDomenic M Recchia Jr Democratic 45,24442.4% GreenHenry J Bardel Green 2,6872.5% - Votes for listed candidates
- 197,485
- Election day
- November 6, 2012
- District map
- Older district map (2012 to 2020)
US House, New York District 11, 2012, every candidate Candidate Party Votes and share Share RepublicanMichael G GrimmWon Republican 103,11852.2% DemocraticMark S Murphy Democratic 92,42846.8% GreenHenry J Bardel Green 1,9391.0% - Votes for listed candidates
- 115,155
- Election day
- November 2, 2010
- District map
- Older district map (2002 to 2010)
US House, New York District 11, 2010, every candidate Candidate Party Votes and share Share DemocraticYvette D. ClarkeWon Democratic 104,29790.6% RepublicanHugh C Carr Republican 10,8589.4% - Votes for listed candidates
- 181,723
- Election day
- November 4, 2008
- District map
- Older district map (2002 to 2010)
US House, New York District 11, 2008, every candidate Candidate Party Votes and share Share DemocraticYvette D. ClarkeWon Democratic 168,56292.8% RepublicanHugh C Carr Republican 11,6446.4% OtherCartrell Gore Other 1,5170.8% - Votes for listed candidates
- 98,102
- Election day
- November 7, 2006
- District map
- Older district map (2002 to 2010)
US House, New York District 11, 2006, every candidate Candidate Party Votes and share Share DemocraticYvette D. ClarkeWon Democratic 88,33490.0% RepublicanStephen Finger Republican 7,4477.6% OtherMarianna Blume Other 1,3251.4% OtherOllie M McClean Other 9961.0% - Votes for listed candidates
- 154,198
- Election day
- November 2, 2004
- District map
- Older district map (2002 to 2010)
US House, New York District 11, 2004, every candidate Candidate Party Votes and share Share DemocraticMajor R OwensWon Democratic 144,99994.0% OtherLorraine Stevens Other 4,7213.1% OtherSol Lieberman Other 4,4782.9% - Votes for listed candidates
- 88,864
- Election day
- November 5, 2002
- District map
- Older district map (2002 to 2010)
US House, New York District 11, 2002, every candidate Candidate Party Votes and share Share DemocraticMajor R OwensWon Democratic 76,91786.6% RepublicanSusan Cleary Republican 11,14912.5% OtherAlice Gaffney Other 7980.9% - Votes for listed candidates
- 128,784
- Election day
- November 7, 2000
- District map
- Older district map (1992 to 2000)
US House, New York District 11, 2000, every candidate Candidate Party Votes and share Share DemocraticMajor R OwensWon Democratic 112,05087.0% RepublicanSusan Cleary Republican 8,4066.5% OtherUna S T Clarke Other 7,3665.7% OtherCartrell Gore Other 9620.7% - Votes for listed candidates
- 84,201
- Election day
- November 3, 1998
- District map
- Older district map (1992 to 2000)
US House, New York District 11, 1998, every candidate Candidate Party Votes and share Share DemocraticMajor R OwensWon Democratic 75,77390.0% RepublicanDavid Greene Republican 7,2848.7% OtherPhyllis Taliaferro Other 1,1441.4% - Votes for listed candidates
- 97,771
- Election day
- November 5, 1996
- District map
- Older district map (1992 to 2000)
US House, New York District 11, 1996, every candidate Candidate Party Votes and share Share DemocraticMajor R OwensWon Democratic 89,90592.0% RepublicanClaudette Hayle Republican 7,8668.0% - Votes for listed candidates
- 92,251
- Election day
- November 8, 1994
- District map
- Older district map (1992 to 2000)
US House, New York District 11, 1994, every candidate Candidate Party Votes and share Share DemocraticMajor R OwensWon Democratic 61,94567.1% Scattered write-insName as filed: Writein Write-in 22,55124.4% RepublicanGary S Popkin Republican 6,6057.2% OtherMichael Gaffney Other 1,1501.2% - Votes for listed candidates
- 85,494
- Election day
- November 3, 1992
- District map
- Older district map (1992 to 2000)
US House, New York District 11, 1992, every candidate Candidate Party Votes and share Share DemocraticMajor R OwensWon Democratic 80,02893.6% OtherMichael Gaffney Other 4,2875.0% OtherErnest N Foster Other 1,1791.4% - Votes for listed candidates
- 61,401
- Election day
- November 6, 1990
- District map
- Older district map (1982 to 1990)
US House, New York District 11, 1990, every candidate Candidate Party Votes and share Share DemocraticEdolphus TownsWon Democratic 36,28659.1% Scattered write-insName as filed: Writein Write-in 22,34536.4% OtherErnest Johnson Other 1,6762.7% OtherLorraine Stevens Other 1,0941.8% - Votes for listed candidates
- 83,158
- Election day
- November 8, 1988
- District map
- Older district map (1982 to 1990)
US House, New York District 11, 1988, every candidate Candidate Party Votes and share Share DemocraticEdolphus TownsWon Democratic 73,75588.7% RepublicanRiaz B Hussain Republican 7,4188.9% OtherAlfred J Hamel Other 1,2711.5% OtherLorraine Stevens Other 7140.9% - Votes for listed candidates
- 46,616
- Election day
- November 4, 1986
- District map
- Older district map (1982 to 1990)
US House, New York District 11, 1986, every candidate Candidate Party Votes and share Share DemocraticEdolphus TownsWon Democratic 41,68989.4% RepublicanNathaniel Hendricks Republican 4,0538.7% OtherAlfred J Hamel Other 8741.9% - Votes for listed candidates
- 95,064
- Election day
- November 6, 1984
- District map
- Older district map (1982 to 1990)
US House, New York District 11, 1984, every candidate Candidate Party Votes and share Share DemocraticEdolphus TownsWon Democratic 81,00285.2% RepublicanNathaniel Hendricks Republican 12,49413.1% OtherAlfred Hamel Other 1,5681.6% - Votes for listed candidates
- 47,010
- Election day
- November 2, 1982
- District map
- Older district map (1982 to 1990)
US House, New York District 11, 1982, every candidate Candidate Party Votes and share Share DemocraticEdolphus TownsWon Democratic 39,35783.7% RepublicanJames W Smith Republican 4,4499.5% OtherPatrick W Giagnacova Other 1,4883.2% OtherJoseph No Caesar Other 1,3572.9% OtherSusan C Zarate Other 3590.8% - Votes for listed candidates
- 98,222
- Election day
- November 4, 1980
- District map
- Older district map (1972 to 1980)
US House, New York District 11, 1980, every candidate Candidate Party Votes and share Share DemocraticJames H ScheuerWon Democratic 72,79874.1% RepublicanAndrew E Carlan Republican 25,42425.9% - Votes for listed candidates
- 75,203
- Election day
- November 7, 1978
- District map
- Older district map (1972 to 1980)
US House, New York District 11, 1978, every candidate Candidate Party Votes and share Share DemocraticJames H ScheuerWon Democratic 58,99778.5% RepublicanKenneth Huhn Republican 16,20621.5% - Votes for listed candidates
- 114,458
- Election day
- November 2, 1976
- District map
- Older district map (1972 to 1980)
US House, New York District 11, 1976, every candidate Candidate Party Votes and share Share DemocraticJames H ScheuerWon Democratic 84,77074.1% RepublicanArthur Cuccia Republican 19,20316.8% OtherBryan F Levinson Other 6,3165.5% OtherJoseph Rothenberg Other 4,1693.6%
All rows: MIT Election Data and Science Lab, U.S. House 1976-2024, retrieved Oct 28, 2026
District numbers are reused after each redistricting, so rows on older lines cover different territory than today's New York District 11.
Download and cite
Cite this page
Election Wrld. (2026). New York District 11, US House results. https://www.electionwrld.com/ny/congress/11. Retrieved October 30, 2026.
Embed this seat
<iframe src="https://www.electionwrld.com/embed/ny/congress/11" title="New York District 11, US House" width="100%" height="400" style="border:0;max-width:640px" loading="lazy"></iframe>
<p style="font-size:13px">Data: <a href="https://www.electionwrld.com">Election Wrld</a>, CC BY 4.0</p>Sources
Sources
- Used for
- web/data/results/house/{ST}.json. The Dataverse API refuses this file behind a guestbook, so the identical file was taken from two public GitHub copies (Hackquantumcpp/snoutcounter-midterms-2026-model data/1976-2024-house.csv and sta199-f26/sta199-f26.github.io _data/gerrymander/1976-2024-house.tab), which are byte-identical to each other and match the md5 a9566ac393913a1af343284e837c17bb that Dataverse lists for dataset version 15.0 (2026-03-09). sha256 76eec42483ee9f0fc5cf6e377442c783d1ae6eefa929729fd6561a69bab47f2a.
- License
- CC0 1.0
- Retrieved
- October 28, 2026
- Link
- https://doi.org/10.7910/DVN/IG0UN2
- Used for
- cd.topo.json, sld/*.topo.json
- License
- US Census Bureau, public domain
- Retrieved
- October 28, 2026
- Link
- https://tigerweb.geo.census.gov/arcgis/rest/services/TIGERweb/Legislative/MapServer
- Used for
- web/data/officials/congress.json (name, party, bioguide, official site, service start) and web/data/people (birth year, committees, social media handles and profile links; links only, nothing copied from the platforms). As-of: the files saved in data/raw/people on 2026-10-29.
- License
- CC0-1.0
- Retrieved
- October 28, 2026
- Link
- https://unitedstates.github.io/congress-legislators/legislators-current.json
DataState data (JSON)Sources: MIT Election Data and Science Lab, U.S. House 1976-2024, FEC, DIME (ODC-BY), Portraits: unitedstates/images (public domain)Data as of Oct 28, 2026