

Ohio Senate
Tue, Nov 3 · Seat held by Jon Husted Republican since Jan 2025
Special election · Tue, Nov 3
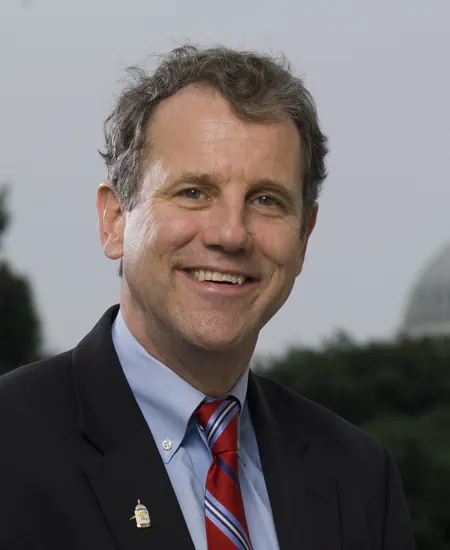
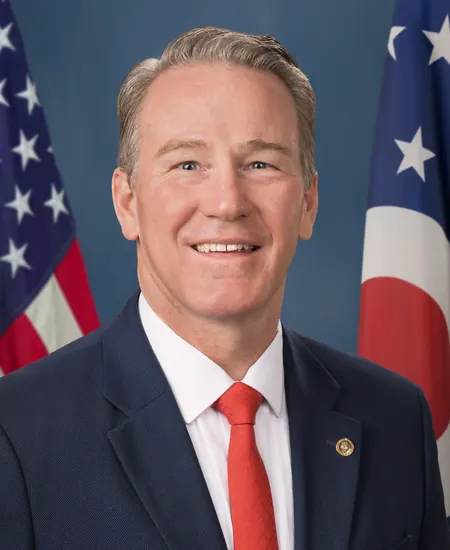
Sherrod Brown 47.1Jon Husted 43.9
Average of 12 polls, Sep 14 to Oct 26, from VoteHub · how it’s calculated
Newest poll
2 are partisan pollsNewest · Suffolk University, field dates Oct 21 to Oct 26, released Oct 30, 500 likely votersPoll sponsored by USA TODAY Network OhioPolls updated Oct 31, 4:06 a.m. ET, from VoteHub
Show all 4 candidates on the ballot
- Sherrod BrownDemocratic
- Jon HustedIncumbentRepublican
- William RedpathLibertarian
- Greg LevyIndependent
Showing major-party nominees, incumbents and candidates with 5%+ in the latest poll or comparable fundraising.
Polls over time
32 polls, through Election Day Nov 3The thick line is the 7-week average, not a forecast. How it’s calculated. All polls. Polls updated Oct 31, 4:06 a.m. ET, from VoteHub.
The polls in this chart (32)
7 polls released in the last 14 days · latest results range from 46.6 to 50% (D) and 40 to 47% (R) (newest 5 polls on the chart)
32 of the 32 polls for this race, each with both names, plotted on the field end date.
| Pollster | Field dates | Released | Sample | Brown | Husted |
|---|---|---|---|---|---|
| Suffolk University | Oct 21 to Oct 26 | Oct 30 | 500 likely voters | 46.6 | 43.8 |
| Echelon Insights | Oct 16 to Oct 23 | Oct 27 | 508 likely voters | 47 | 47 |
| InsiderAdvantage | Oct 21 to Oct 22 | Oct 23 | 1,200 likely voters | 47 | 44 |
| VoteHub/Verasight | Oct 1 to Oct 20 | Oct 22 | 623 likely voters | 47.5 | 43.6 |
| Beacon Research/Shaw & Co. Research | Oct 15 to Oct 19 | Oct 22 | 1,592 likely voters | 52 | 47 |
| Marist University | Oct 15 to Oct 18 | Oct 20 | — | 48 | 44 |
| Bowling Green State University/YouGov | Sep 29 to Oct 9 | Oct 16 | 1,000 likely voters | 48 | 42 |
| co/efficient | Oct 5 to Oct 6 | Oct 9 | 925 likely voters | 43 | 44 |
| co/efficient | Oct 5 to Oct 6 | Oct 9 | 925 likely voters | 45 | 46 |
| CNN/SSRS | Sep 29 to Oct 5 | Oct 8 | 760 likely voters | 49 | 43 |
| InsiderAdvantage | Sep 28 to Sep 29 | Oct 2 | 1,200 likely voters | 44 | 43 |
| Big Data Poll | Sep 26 to Sep 27 | Sep 29 | 680 likely voters | 45.5 | 41.6 |
| Marist University | Sep 24 to Sep 27 | Sep 29 | 1,298 registered voters | 51 | 43 |
| Quantus Insights | Sep 21 to Sep 23 | Sep 25 | 695 likely voters | 45.6 | 45.3 |
| Trafalgar Group | Sep 14 to Sep 16 | Sep 18 | 1,085 likely voters | 45.4 | 41.5 |
| InsiderAdvantage | Sep 8 to Sep 9 | Sep 11 | 1,200 likely voters | 47.3 | 41.9 |
| Concord Public Opinion Partners | Sep 29 to Aug 31 | Oct 29 | 504 likely voters | 50 | 40 |
| Wedgewood Polls | Aug 11 to Aug 13 | Aug 15 | 800 likely voters | 48 | 44 |
| Beacon Research/Shaw & Co. Research | Aug 6 to Aug 10 | Aug 14 | 1,008 registered voters | 53 | 45 |
| The New York Times/Siena University | Jun 15 to Jun 28 | Jul 1 | 601 likely voters | 47 | 50 |
| Fabrizio Ward/Impact Research | Jun 14 to Jun 16 | Jun 25 | 800 likely voters | 48 | 45 |
| Beacon Research/Shaw & Co. Research | May 28 to Jun 1 | Jun 3 | 1,015 registered voters | 53 | 45 |
| Bowling Green State University/YouGov | Apr 7 to Apr 14 | Apr 21 | 1,000 registered voters | 47 | 50 |
| Echelon Insights | Apr 3 to Apr 9 | Apr 21 | — | 45 | 51 |
| Quantus Insights | Mar 13 to Mar 14 | Mar 16 | 925 likely voters | 44 | 46 |
| OnMessage | Mar 3 to Mar 8 | Mar 12 | 600 likely voters | 47 | 45 |
| EMC Research | Feb 10 to Feb 22 | Mar 12 | 1,343 likely voters | 51 | 47 |
| Emerson College | Dec 6 to Dec 8 | Mar 12 | 850 registered voters | 46.3 | 48.8 |
| Bowling Green State University/YouGov | Oct 2 to Oct 14 | Mar 12 | 800 registered voters | 49 | 48 |
| Emerson College | Aug 18 to Aug 19 | Mar 12 | 1,000 registered voters | 43.7 | 49.5 |
| Bowling Green State University/YouGov | Apr 18 to Apr 24 | Mar 12 | 800 registered voters | 46 | 49 |
| Bowling Green State University/YouGov | Feb 14 to Feb 21 | Mar 12 | 800 registered voters | 41 | 47 |
Side by side
Left column: BrownRight column: Husted
- Total receipts, 2025-2026 cycle, through Oct 22
- $68.4M
- $19.9M
- Cash on hand
- $4.5M
- $4.2M
- Donor-based spectrum
- LiberalCentristConservativeBrownNo published score for Husted
- Races
- Won 10 of 11
- None listed
- Years since first win
- 20
- 1
- Age on Election Day
- 73
- 59
Money: FEC bulk data, through Oct 22. One or more are matched to the FEC by name, party and seat, so a total could belong to someone else.
How these are counted
Total receipts line of each candidate’s principal campaign committee, 2025-2026 cycle, filed through Oct 14 and Oct 22. Other sites may show career, six-year or all-committee totals, which differ. Brown: $68,409,200 received, $4,452,803 cash on hand. Husted: $19,894,786 received, $4,239,097 cash on hand. The spectrum is a published research score, not our rating. How this works. Wins and losses count the races in our results files, the same as each profile.
What changed in this race
Newest firstNEW POLLOhio Senate
Ohio Senate: Sherrod Brown 46.6, Jon Husted 43.8
Suffolk University, Oct 21 to Oct 26, 500 likely voters
NEW POLLOhio Senate
Ohio Senate: Sherrod Brown 50, Jon Husted 40
Concord Public Opinion Partners, Sep 29 to Aug 31, 504 likely voters
More about this race
Candidates on the ballot
- Sherrod BrownDemocratic
- Jon HustedIncumbentRepublican
- William RedpathLibertarian
- Greg LevyIndependent
Source: liveresults.ohiosos.gov, dated Oct 29
Seat on the ballot, shift from 2016 to 2022: 14.7 points toward Democrats (Republican by 20.8 in 2016, Republican by 6.1 in 2022).
Vote in Ohio
Trouble voting? Election Protection hotline: 866-OUR-VOTE. A nonpartisan coalition of civil-rights and voting-rights groups, not a government service. 866ourvote.org
History (17 elections for this seat)
- Votes for listed candidates
- 5,704,620
- Election day
- November 5, 2024
US Senate, Ohio, 2024, every candidate Candidate Party Votes and share Share RepublicanBernie MorenoWon Republican 2,857,38350.1% DemocraticSherrod Brown Democratic 2,650,94946.5% LibertarianDon Kissick Libertarian 195,6483.4% OtherOther Other 6400.0% - Votes for listed candidates
- 4,133,342
- Election day
- November 8, 2022
US Senate, Ohio, 2022, every candidate Candidate Party Votes and share Share RepublicanJD VanceWon Republican 2,192,11453.0% DemocraticTim Ryan Democratic 1,939,48946.9% OtherOther Other 1,7390.0% - Votes for listed candidates
- 4,410,898
- Election day
- November 6, 2018
US Senate, Ohio, 2018, every candidate Candidate Party Votes and share Share DemocraticSherrod BrownWon Democratic 2,355,92353.4% RepublicanJim Renacci Republican 2,053,96346.6% Scattered write-ins Write-in 1,0120.0% - Votes for listed candidates
- 5,374,164
- Election day
- November 8, 2016
US Senate, Ohio, 2016, every candidate Candidate Party Votes and share Share RepublicanRob PortmanWon Republican 3,118,56758.0% DemocraticTed Strickland Democratic 1,996,90837.2% IndependentTom Connors Independent 93,0411.7% GreenJoseph R. Demare Green 88,2461.6% IndependentScott Rupert Independent 77,2911.4% Scattered write-ins Write-in 1110.0% - Votes for listed candidates
- 5,449,018
- Election day
- November 6, 2012
US Senate, Ohio, 2012, every candidate Candidate Party Votes and share Share DemocraticSherrod BrownWon Democratic 2,762,69050.7% RepublicanJosh Mandel Republican 2,435,71244.7% IndependentScott A. Rupert Independent 250,6164.6% - Votes for listed candidates
- 3,815,098
- Election day
- November 2, 2010
US Senate, Ohio, 2010, every candidate Candidate Party Votes and share Share RepublicanRob PortmanWon Republican 2,168,74256.8% DemocraticLee Fisher Democratic 1,503,29739.4% OtherEric W. Deaton Other 65,8561.7% IndependentMichael L. Pryce Independent 50,1011.3% OtherDaniel H. Labotz Other 26,4540.7% Scattered write-ins Write-in 6480.0% - Votes for listed candidates
- 4,019,236
- Election day
- November 7, 2006
US Senate, Ohio, 2006, every candidate Candidate Party Votes and share Share DemocraticSherrod BrownWon Democratic 2,257,36956.2% RepublicanMike DeWine Republican 1,761,03743.8% Scattered write-ins Write-in 8300.0% - Votes for listed candidates
- 5,425,823
- Election day
- November 2, 2004
US Senate, Ohio, 2004, every candidate Candidate Party Votes and share Share RepublicanGeorge V. VoinovichWon Republican 3,464,35663.8% DemocraticEric D. Fingerhut Democratic 1,961,17136.1% Scattered write-ins Write-in 2960.0% - Votes for listed candidates
- 4,448,801
- Election day
- November 7, 2000
US Senate, Ohio, 2000, every candidate Candidate Party Votes and share Share RepublicanMike DeWineWon Republican 2,665,51259.9% DemocraticTed Celeste Democratic 1,595,06635.9% LibertarianJohn R. McAlister Libertarian 116,7242.6% OtherJohn A. Eastman Other 70,7131.6% Scattered write-ins Write-in 7860.0% - Votes for listed candidates
- 3,404,351
- Election day
- November 3, 1998
US Senate, Ohio, 1998, every candidate Candidate Party Votes and share Share RepublicanGeorge V. VoinovichWon Republican 1,922,08756.5% DemocraticMary O. Boyle Democratic 1,482,05443.5% Scattered write-ins Write-in 2100.0% - Votes for listed candidates
- 3,436,884
- Election day
- November 8, 1994
US Senate, Ohio, 1994, every candidate Candidate Party Votes and share Share RepublicanMike DeWineWon Republican 1,836,55653.4% DemocraticJoel Hyatt Democratic 1,348,21339.2% IndependentJoseph J. Slovenec Independent 252,0317.3% Scattered write-ins Write-in 840.0% - Votes for listed candidates
- 4,793,953
- Election day
- November 3, 1992
US Senate, Ohio, 1992, every candidate Candidate Party Votes and share Share DemocraticJohn GlennWon Democratic 2,444,41951.0% RepublicanMichael DeWine Republican 2,028,30042.3% IndependentMartha Grevatt Independent 321,2346.7% - Votes for listed candidates
- 4,352,905
- Election day
- November 8, 1988
US Senate, Ohio, 1988, every candidate Candidate Party Votes and share Share DemocraticHoward M. MetzenbaumWon Democratic 2,480,03857.0% RepublicanGeorge V. Voinovich Republican 1,872,71643.0% Scattered write-ins Write-in 1510.0% - Votes for listed candidates
- 3,121,189
- Election day
- November 4, 1986
US Senate, Ohio, 1986, every candidate Candidate Party Votes and share Share DemocraticJohn GlennWon Democratic 1,949,20862.5% RepublicanThomas N. Kindness Republican 1,171,89337.5% Scattered write-ins Write-in 880.0% - Votes for listed candidates
- 3,395,463
- Election day
- November 2, 1982
US Senate, Ohio, 1982, every candidate Candidate Party Votes and share Share DemocraticHoward M. MetzenbaumWon Democratic 1,923,76756.7% RepublicanPaul E. Pfeifer Republican 1,396,79041.1% IndependentAlicia Merel Independent 38,8031.1% LibertarianPhilip Herzing Libertarian 36,1031.1% - Votes for listed candidates
- 4,027,303
- Election day
- November 4, 1980
US Senate, Ohio, 1980, every candidate Candidate Party Votes and share Share DemocraticJohn GlennWon Democratic 2,770,78668.8% RepublicanJames E. Betts Republican 1,137,69528.2% IndependentJohn E. Powers Independent 76,4121.9% Scattered write-ins Write-in 42,4101.1% - Votes for listed candidates
- 3,920,613
- Election day
- November 2, 1976
US Senate, Ohio, 1976, every candidate Candidate Party Votes and share Share DemocraticHoward M. MetzenbaumWon Democratic 1,941,11349.5% RepublicanRobert Taft, Jr. Republican 1,823,77446.5% IndependentJohn O'Neill Independent 53,6571.4% OtherDonald E. Babcock Other 36,9790.9% IndependentEmma Lila Fundaburk Independent 33,2850.8% OtherMelisa Singler Other 31,8050.8%
1976 to 2024: MIT Election Data and Science Lab, U.S. Senate statewide 1976-2024, retrieved Oct 28, 2026. Compiled by MIT Election Data and Science Lab (MEDSL) from official returns; not an official source
Download and cite
Cite this page
Election Wrld. (2026). US Senate in Ohio, election results. https://www.electionwrld.com/oh/us-senate. Retrieved October 31, 2026.
Sources
Sources: U.S. Senate: senators contact information XML (class per senator) (US government work, public domain), retrieved Oct 28, 2026; MIT Election Data and Science Lab, U.S. Senate statewide 1976-2024 (CC0 1.0), retrieved Oct 28, 2026, compiled by MIT Election Data and Science Lab (MEDSL) from official returns, not an official source; unitedstates/congress-legislators (current) (CC0-1.0), retrieved Oct 28, 2026, compiled by the @unitedstates project volunteers (rosters from official congressional sources) from official returns, not an official source.
DataState data (JSON)Sources: MIT Election Data and Science Lab, U.S. Senate statewide 1976-2024, VoteHub polls (CC BY 4.0), FEC, DIME (ODC-BY), Photo creditsData as of Oct 30, 2026 (candidate list Oct 29, 2026)