

Tennessee District 2
Tue, Nov 3 · Seat held by Tim Burchett Republican since Jan 2019
No published poll names both candidates.Last result · 2024 general: Tim Burchett (R) 69.3, Jane George (D) 30.7
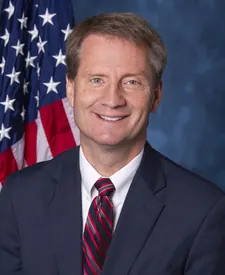
Show all 4 candidates on the ballot
- Michaela BarnettDemocratic
- Tim BurchettIncumbentRepublican
- Adam HeimermanIndependent
- Bruce FineIndependent
Showing major-party nominees, incumbents and candidates with 5%+ in the latest poll or comparable fundraising.
- Last election
- Tim Burchett (Republican) won by 38.6 points, 2024
- Margin since 2022
- 2.8 points toward Republicans
- On the 2026 ballot
- 4 candidates
Side by side
Left column: BarnettRight column: Burchett
- Total receipts, 2025-2026 cycle, through Oct 14
- $718K
- $3.1M
- Cash on hand
- $130K
- $914K
- Donor-based spectrum
- LiberalCentristConservativeBurchettNo published score for Barnett
- Races
- None listed
- Won 9 of 9
- Years since first win
- Not available
- 7
- Age on Election Day
- Not available
- 62
Money: FEC bulk data, through Oct 14. One or more are matched to the FEC by name, party and seat, so a total could belong to someone else.
How these are counted
Total receipts line of each candidate’s principal campaign committee, 2025-2026 cycle. Other sites may show career, six-year or all-committee totals, which differ. Barnett: $717,842 received, $130,251 cash on hand. Burchett: $3,131,315 received, $914,111 cash on hand. The spectrum is a published research score, not our rating. How this works. Wins and losses count the races in our results files, the same as each profile.
More about this race
Candidates on the ballot
- Michaela BarnettDemocratic
- Tim BurchettIncumbentRepublican
- Adam HeimermanIndependent
- Bruce FineIndependent
Source: sos-prod.tnsosgovfiles.com (XLSX), dated Sep 3
Shift since 2022: 2.8 points toward Republicans (Republican by 35.8 in 2022, Republican by 38.6 in 2024).
All Tennessee districts
- D 15+ pts
- D 5 to 15 pts
- D under 5 pts
- R under 5 pts
- R 5 to 15 pts
- R 15+ pts
- Other winner
- No data
Show these districts as a list (9)
- Tennessee District 1· Diana Harshbarger (R), Republican by 58.7 points, 2024
- Tennessee District 2· Tim Burchett (R), Republican by 38.6 points, 2024
- Tennessee District 3· New lines for 2026, old result not shown
- Tennessee District 4· New lines for 2026, old result not shown
- Tennessee District 5· New lines for 2026, old result not shown
- Tennessee District 6· New lines for 2026, old result not shown
- Tennessee District 7· New lines for 2026, old result not shown
- Tennessee District 8· New lines for 2026, old result not shown
- Tennessee District 9· New lines for 2026, old result not shown
Map settings
Vote in Tennessee
Trouble voting? Election Protection hotline: 866-OUR-VOTE. A nonpartisan coalition of civil-rights and voting-rights groups, not a government service. 866ourvote.org
Official results for Tennessee
History (25 elections for this seat)
- Votes for listed candidates
- 362,098
- Election day
- November 5, 2024
- District map
- Same as today
US House, Tennessee District 2, 2024, every candidate Candidate Party Votes and share Share RepublicanTim BurchettWon Republican 250,78269.3% DemocraticJane George Democratic 111,31630.7% - Votes for listed candidates
- 207,762
- Election day
- November 8, 2022
- District map
- Same as today
US House, Tennessee District 2, 2022, every candidate Candidate Party Votes and share Share RepublicanTim BurchettWon Republican 141,08967.9% DemocraticMark Harmon Democratic 66,67332.1% - Votes for listed candidates
- 353,197
- Election day
- November 3, 2020
- District map
- Older district map (2012 to 2020)
US House, Tennessee District 2, 2020, every candidate Candidate Party Votes and share Share RepublicanTim BurchettWon Republican 238,90767.6% DemocraticRenee Hoyos Democratic 109,68431.1% IndependentMatthew L Campbell Independent 4,5921.3% David Dockery Write-in 70.0% Ronald Cornell Jr Write-in 70.0% - Votes for listed candidates
- 262,134
- Election day
- November 6, 2018
- District map
- Older district map (2012 to 2020)
US House, Tennessee District 2, 2018, every candidate Candidate Party Votes and share Share RepublicanTim BurchettWon Republican 172,85665.9% DemocraticRenee Hoyos Democratic 86,66833.1% IndependentGreg Samples Independent 9670.4% IndependentJeffrey A Grunau Independent 6570.3% IndependentMarc Whitmire Independent 6370.2% IndependentKeith A Latorre Independent 3490.1% - Votes for listed candidates
- 280,856
- Election day
- November 8, 2016
- District map
- Older district map (2012 to 2020)
US House, Tennessee District 2, 2016, every candidate Candidate Party Votes and share Share RepublicanJohn J Duncan JrWon Republican 212,45575.6% DemocraticStuart Starr Democratic 68,40124.4% - Votes for listed candidates
- 166,751
- Election day
- November 4, 2014
- District map
- Older district map (2012 to 2020)
US House, Tennessee District 2, 2014, every candidate Candidate Party Votes and share Share RepublicanJohn J Duncan JrWon Republican 120,88372.5% DemocraticBob Scott Democratic 37,61222.6% IndependentCasey Adam Gouge Independent 4,2232.5% GreenNorris Dryer Green 4,0332.4% - Votes for listed candidates
- 264,505
- Election day
- November 6, 2012
- District map
- Older district map (2012 to 2020)
US House, Tennessee District 2, 2012, every candidate Candidate Party Votes and share Share RepublicanJohn J Duncan JrWon Republican 196,89474.4% DemocraticTroy Christopher Goodale Democratic 54,52220.6% GreenNorris Dryer Green 5,7332.2% IndependentGreg Samples Independent 4,3821.7% IndependentBrandon Stewart Independent 2,9741.1% - Votes for listed candidates
- 173,380
- Election day
- November 2, 2010
- District map
- Older district map (2002 to 2010)
US House, Tennessee District 2, 2010, every candidate Candidate Party Votes and share Share RepublicanJohn J Duncan JrWon Republican 141,79681.8% DemocraticDave Hancock Democratic 25,40014.6% IndependentJoseph R Leinweber Independent 2,4971.4% IndependentD H "Andy" Andrew Independent 1,9931.1% IndependentGreg Samples Independent 1,1850.7% IndependentH James Headings Independent 5090.3% - Votes for listed candidates
- 290,759
- Election day
- November 4, 2008
- District map
- Older district map (2002 to 2010)
US House, Tennessee District 2, 2008, every candidate Candidate Party Votes and share Share RepublicanJohn J Duncan JrWon Republican 227,12078.1% DemocraticBob Scott Democratic 63,63921.9% - Votes for listed candidates
- 202,120
- Election day
- November 7, 2006
- District map
- Older district map (2002 to 2010)
US House, Tennessee District 2, 2006, every candidate Candidate Party Votes and share Share RepublicanJohn J Duncan JrWon Republican 157,09577.7% DemocraticJohn Greene Democratic 45,02522.3% - Votes for listed candidates
- 272,928
- Election day
- November 2, 2004
- District map
- Older district map (2002 to 2010)
US House, Tennessee District 2, 2004, every candidate Candidate Party Votes and share Share RepublicanJohn J DuncanWon Republican 215,79579.1% DemocraticJohn Greene Democratic 52,15519.1% IndependentCharles E Howard Independent 4,9781.8% - Votes for listed candidates
- 185,981
- Election day
- November 5, 2002
- District map
- Older district map (2002 to 2010)
US House, Tennessee District 2, 2002, every candidate Candidate Party Votes and share Share RepublicanJohn J Duncan JrWon Republican 146,88779.0% DemocraticJohn Greene Democratic 37,03519.9% IndependentJoshua Williamson Independent 1,1100.6% IndependentGeorge Njezic Independent 9400.5% Scattered write-insName as filed: Writein Write-in 90.0% - Votes for listed candidates
- 209,485
- Election day
- November 7, 2000
- District map
- Older district map (1992 to 2000)
US House, Tennessee District 2, 2000, every candidate Candidate Party Votes and share Share RepublicanJohn J Duncan JrWon Republican 187,15489.3% LibertarianKevin J Rowland Libertarian 22,30410.6% Scattered write-insName as filed: Writein Write-in 270.0% - Votes for listed candidates
- 102,502
- Election day
- November 3, 1998
- District map
- Older district map (1992 to 2000)
US House, Tennessee District 2, 1998, every candidate Candidate Party Votes and share Share RepublicanJohn J DuncanWon Republican 90,86088.6% IndependentRobert O Watson Independent 4,3724.3% IndependentGreg Samples Independent 4,3324.2% IndependentGeorge Njezic Independent 2,9202.8% Scattered write-insName as filed: Writein Write-in 180.0% - Votes for listed candidates
- 213,574
- Election day
- November 5, 1996
- District map
- Older district map (1992 to 2000)
US House, Tennessee District 2, 1996, every candidate Candidate Party Votes and share Share RepublicanJohn J Duncan JrWon Republican 150,95370.7% DemocraticStephen Smith Democratic 61,02028.6% IndependentChris G Dimit Independent 1,3060.6% IndependentGeorge Njezic Independent 2890.1% Scattered write-insName as filed: Writein Write-in 60.0% - Votes for listed candidates
- 142,482
- Election day
- November 8, 1994
- District map
- Older district map (1992 to 2000)
US House, Tennessee District 2, 1994, every candidate Candidate Party Votes and share Share RepublicanJohn J Duncan JrWon Republican 128,93790.5% IndependentRandon K Krieg Independent 6,8544.8% IndependentGreg Samples Independent 6,6824.7% Scattered write-insName as filed: Writein Write-in 90.0% - Votes for listed candidates
- 205,401
- Election day
- November 3, 1992
- District map
- Older district map (1992 to 2000)
US House, Tennessee District 2, 1992, every candidate Candidate Party Votes and share Share RepublicanJohn J Duncan JrWon Republican 148,37772.2% DemocraticTroy Goodale Democratic 52,88725.7% IndependentRandon J Krieg Independent 4,1342.0% Scattered write-insName as filed: Writein Write-in 30.0% - Votes for listed candidates
- 77,944
- Election day
- November 6, 1990
- District map
- Older district map (1982 to 1990)
US House, Tennessee District 2, 1990, every candidate Candidate Party Votes and share Share RepublicanJohn J Duncan JrWon Republican 62,79780.6% IndependentPeter Hebert Independent 15,12719.4% Scattered write-insName as filed: Writein Write-in 200.0% - Votes for listed candidates
- 177,174
- Election day
- November 8, 1988
- District map
- Older district map (1982 to 1990)
US House, Tennessee District 2, 1988, every candidate Candidate Party Votes and share Share RepublicanJohn J Duncan JrWon Republican 99,63156.2% DemocraticDudley W Taylor Democratic 77,54043.8% Scattered write-insName as filed: Writein Write-in 30.0% - Votes for listed candidates
- 126,486
- Election day
- November 4, 1986
- District map
- Older district map (1982 to 1990)
US House, Tennessee District 2, 1986, every candidate Candidate Party Votes and share Share RepublicanJohn J DuncanWon Republican 96,39676.2% DemocraticJohn F Bowen Democratic 30,08823.8% Scattered write-insName as filed: Writein Write-in 20.0% - Votes for listed candidates
- 171,453
- Election day
- November 6, 1984
- District map
- Older district map (1982 to 1990)
US House, Tennessee District 2, 1984, every candidate Candidate Party Votes and share Share RepublicanJohn J DuncanWon Republican 132,60477.3% DemocraticJohn F Bowen Democratic 38,84622.7% OtherOther Other 30.0% - Votes for listed candidates
- 109,057
- Election day
- November 2, 1982
- District map
- Older district map (1982 to 1990)
US House, Tennessee District 2, 1982, every candidate Candidate Party Votes and share Share RepublicanJohn J DuncanWon Republican 109,045100.0% Scattered write-insName as filed: Writein Write-in 120.0% - Votes for listed candidates
- 194,527
- Election day
- November 4, 1980
- District map
- Older district map (1972 to 1980)
US House, Tennessee District 2, 1980, every candidate Candidate Party Votes and share Share RepublicanJohn J DuncanWon Republican 147,94776.1% DemocraticDavid H "Dave" Dunnaway Democratic 46,57823.9% Scattered write-insName as filed: Writein Write-in 20.0% - Votes for listed candidates
- 152,833
- Election day
- November 7, 1978
- District map
- Older district map (1972 to 1980)
US House, Tennessee District 2, 1978, every candidate Candidate Party Votes and share Share RepublicanJohn J DuncanWon Republican 125,08281.8% DemocraticMargaret Francis Democratic 27,74518.2% Scattered write-insName as filed: Writein Write-in 60.0% - Votes for listed candidates
- 186,707
- Election day
- November 2, 1976
- District map
- Older district map (1972 to 1980)
US House, Tennessee District 2, 1976, every candidate Candidate Party Votes and share Share RepublicanJohn J DuncanWon Republican 117,25662.8% DemocraticMike Rowland Democratic 69,44937.2% Scattered write-insName as filed: Writein Write-in 20.0%
1976 to 2024: MIT Election Data and Science Lab, U.S. House 1976-2024, retrieved Oct 28, 2026. Compiled by MIT Election Data and Science Lab (MEDSL) from official returns; not an official source
District numbers are reused after each redistricting, so rows on older lines cover different territory than today's Tennessee District 2.
Download and cite
Cite this page
Election Wrld. (2026). Tennessee District 2, US House results. https://www.electionwrld.com/tn/congress/2. Retrieved October 30, 2026.
Embed this seat
<iframe src="https://www.electionwrld.com/embed/tn/congress/2" title="Tennessee District 2, US House" width="100%" height="400" style="border:0;max-width:640px" loading="lazy"></iframe>
<p style="font-size:13px">Data: <a href="https://www.electionwrld.com">Election Wrld</a>, CC BY 4.0</p>Sources
Sources: MIT Election Data and Science Lab, U.S. House 1976-2024 (CC0 1.0), retrieved Oct 28, 2026, compiled by MIT Election Data and Science Lab (MEDSL) from official returns, not an official source; Census TIGERweb Legislative MapServer (120th CDs layer 0, 119th CDs layer 4, 2026 SLD upper layer 1 and lower layer 2) (US Census Bureau, public domain), retrieved Oct 28, 2026; unitedstates/congress-legislators (current) (CC0-1.0), retrieved Oct 28, 2026, compiled by the @unitedstates project volunteers (rosters from official congressional sources) from official returns, not an official source.
DataState data (JSON)Sources: MIT Election Data and Science Lab, U.S. House 1976-2024, FEC, DIME (ODC-BY), Portraits: unitedstates/images (public domain)Data as of Oct 28, 2026