

Tennessee District 8
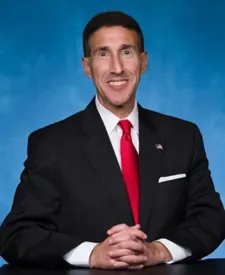
Tue, Nov 3 · Sitting member, elected on the old lines David Kustoff Republican since Jan 2017
No published poll names both candidates.District lines changed for 2026. Results from the old lines aren't shown.
Show all 8 candidates on the ballot
- Heidi KuhnDemocratic
- David KustoffIncumbentRepublican
- Adam D. AustillIndependent
- Antonio FutchIndependent
- Henry J. Ward, IIIIndependent
- Horace TaylorIndependent
- Pamela Jeanine "P." MosesIndependent
- Wendell "Wells" BlankenshipIndependent
Showing major-party nominees, incumbents and candidates with 5%+ in the latest poll or comparable fundraising.
- Lines for 2026
- Redrawn. 38.9% of residents were in a different district in 2024
- On the 2026 ballot
- 8 candidates
Side by side
Left column: KuhnRight column: Kustoff
- Total receipts, 2025-2026 cycle, through Oct 14
- $112K
- $2.6M
- Cash on hand
- $7K
- $2.7M
- Donor-based spectrum
- LiberalCentristConservativeKustoffNo published score for Kuhn
- Races
- None listed
- Won 5 of 6
- Years since first win
- Not available
- 9
- Age on Election Day
- Not available
- 60
Where the money came from
- Individuals
- $108K
- $1.2M
- PACs and other committees
- $3K
- $1.2M
- Party committees
- $1K
- $0
- Candidate’s own money
- $0
- $0
- Loans from the candidate
- $0
- $0
As each campaign reported to the FEC. Some money has no line here, so these may not add up to the total. Committees giving to Heidi Kuhn. Committees giving to David Kustoff.
Money: FEC bulk data, through Oct 14. One or more are matched to the FEC by name, party and seat, so a total could belong to someone else.
How these are counted
Total receipts line of each candidate’s principal campaign committee, 2025-2026 cycle. Other sites may show career, six-year or all-committee totals, which differ. Kuhn: $112,309 received, $6,589 cash on hand. Kustoff: $2,585,197 received, $2,719,271 cash on hand. The spectrum is a published research score, not our rating. How this works. Wins and losses count the races in our results files, the same as each profile.
More about this race
Candidates on the ballot
- Heidi KuhnDemocratic
- David KustoffIncumbentRepublican
- Adam D. AustillIndependent
- Antonio FutchIndependent
- Henry J. Ward, IIIIndependent
- Horace TaylorIndependent
- Pamela Jeanine "P." MosesIndependent
- Wendell "Wells" BlankenshipIndependent
Source: sos-prod.tnsosgovfiles.com (XLSX), dated Sep 3
All Tennessee districts
- D 15+ pts
- D 5 to 15 pts
- D under 5 pts
- R under 5 pts
- R 5 to 15 pts
- R 15+ pts
- Other winner
- No data
Show these districts as a list (9)
- Tennessee District 1· Diana Harshbarger (R), Republican by 58.7 points, 2024
- Tennessee District 2· Tim Burchett (R), Republican by 38.6 points, 2024
- Tennessee District 3· New lines for 2026, old result not shown
- Tennessee District 4· New lines for 2026, old result not shown
- Tennessee District 5· New lines for 2026, old result not shown
- Tennessee District 6· New lines for 2026, old result not shown
- Tennessee District 7· New lines for 2026, old result not shown
- Tennessee District 8· New lines for 2026, old result not shown
- Tennessee District 9· New lines for 2026, old result not shown
Map settings
Vote in Tennessee
Trouble voting? Election Protection hotline: 866-OUR-VOTE. A nonpartisan coalition of civil-rights and voting-rights groups, not a government service. 866ourvote.org
Official results for Tennessee
History (25 elections for this seat)
- Votes for listed candidates
- 332,315
- Election day
- November 5, 2024
- District map
- Older district map (2022 to 2025)
US House, Tennessee District 8, 2024, every candidate Candidate Party Votes and share Share RepublicanDavid KustoffWon Republican 240,41172.3% DemocraticSarah Freeman Democratic 85,04325.6% IndependentJames Hart Independent 6,8612.1% - Votes for listed candidates
- 210,315
- Election day
- November 8, 2022
- District map
- Older district map (2022 to 2025)
US House, Tennessee District 8, 2022, every candidate Candidate Party Votes and share Share RepublicanDavid KustoffWon Republican 155,60274.0% DemocraticLynnette P Williams Democratic 51,10224.3% IndependentJames Hart Independent 2,5411.2% IndependentRonnie Henley Independent 1,0700.5% - Votes for listed candidates
- 331,853
- Election day
- November 3, 2020
- District map
- Older district map (2012 to 2020)
US House, Tennessee District 8, 2020, every candidate Candidate Party Votes and share Share RepublicanDavid KustoffWon Republican 227,21668.5% DemocraticErika Stotts Pearson Democratic 97,89029.5% IndependentJames Hart Independent 3,7631.1% IndependentJon Dillard Independent 2,9840.9% - Votes for listed candidates
- 248,345
- Election day
- November 6, 2018
- District map
- Older district map (2012 to 2020)
US House, Tennessee District 8, 2018, every candidate Candidate Party Votes and share Share RepublicanDavid KustoffWon Republican 168,03067.7% DemocraticErika Stotts Pearson Democratic 74,75530.1% IndependentJames Hart Independent 5,5602.2% - Votes for listed candidates
- 282,733
- Election day
- November 8, 2016
- District map
- Older district map (2012 to 2020)
US House, Tennessee District 8, 2016, every candidate Candidate Party Votes and share Share RepublicanDavid KustoffWon Republican 194,38668.8% DemocraticRickey Hobson Democratic 70,92525.1% IndependentShelia L Godwin Independent 6,4422.3% IndependentJames Hart Independent 4,0571.4% IndependentAdrian M Montague Independent 2,4970.9% IndependentMark J Rawles Independent 2,4450.9% IndependentKaren Free Spirit Talley-Lane Independent 1,9810.7% - Votes for listed candidates
- 172,595
- Election day
- November 4, 2014
- District map
- Older district map (2012 to 2020)
US House, Tennessee District 8, 2014, every candidate Candidate Party Votes and share Share RepublicanStephen Lee FincherWon Republican 122,25570.8% DemocraticWes Bradley Democratic 42,43324.6% OtherMark Rawles Other 4,4512.6% IndependentJames Hart Independent 3,4522.0% Scattered write-insName as filed: Writein Write-in 40.0% - Votes for listed candidates
- 279,422
- Election day
- November 6, 2012
- District map
- Older district map (2012 to 2020)
US House, Tennessee District 8, 2012, every candidate Candidate Party Votes and share Share RepublicanStephen Lee FincherWon Republican 190,92368.3% DemocraticTimothy D Dixon Democratic 79,49028.4% IndependentJames Hart Independent 6,1392.2% IndependentMark J Rawles Independent 2,8701.0% - Votes for listed candidates
- 167,405
- Election day
- November 2, 2010
- District map
- Older district map (2002 to 2010)
US House, Tennessee District 8, 2010, every candidate Candidate Party Votes and share Share RepublicanStephen Lee FincherWon Republican 98,75959.0% DemocraticRoy Herron Democratic 64,96038.8% IndependentDonn Janes Independent 2,4401.5% IndependentMark J Rawles Independent 1,2370.7% Scattered write-insName as filed: Writein Write-in 90.0% - Votes for listed candidates
- 180,519
- Election day
- November 4, 2008
- District map
- Older district map (2002 to 2010)
US House, Tennessee District 8, 2008, every candidate Candidate Party Votes and share Share DemocraticJohn S TannerWon Democratic 180,465100.0% Scattered write-insName as filed: Writein Write-in 540.0% - Votes for listed candidates
- 177,108
- Election day
- November 7, 2006
- District map
- Older district map (2002 to 2010)
US House, Tennessee District 8, 2006, every candidate Candidate Party Votes and share Share DemocraticJohn S TannerWon Democratic 129,61073.2% RepublicanJohn Farmer Republican 47,49226.8% IndependentJames Hart Independent 60.0% - Votes for listed candidates
- 233,567
- Election day
- November 2, 2004
- District map
- Older district map (2002 to 2010)
US House, Tennessee District 8, 2004, every candidate Candidate Party Votes and share Share DemocraticJohn S TannerWon Democratic 173,62374.3% RepublicanJames L Hart Republican 59,85325.6% Scattered write-insName as filed: Writein Write-in 910.0% - Votes for listed candidates
- 167,970
- Election day
- November 5, 2002
- District map
- Older district map (2002 to 2010)
US House, Tennessee District 8, 2002, every candidate Candidate Party Votes and share Share DemocraticJohn S TannerWon Democratic 117,81170.1% RepublicanMat McClain Republican 45,85327.3% IndependentJames L Hart Independent 4,2882.6% Scattered write-insName as filed: Writein Write-in 180.0% - Votes for listed candidates
- 198,080
- Election day
- November 7, 2000
- District map
- Older district map (1992 to 2000)
US House, Tennessee District 8, 2000, every candidate Candidate Party Votes and share Share DemocraticJohn S TannerWon Democratic 143,12772.3% RepublicanBilly Yancy Republican 54,92927.7% Scattered write-insName as filed: Writein Write-in 240.0% - Votes for listed candidates
- 76,825
- Election day
- November 3, 1998
- District map
- Older district map (1992 to 2000)
US House, Tennessee District 8, 1998, every candidate Candidate Party Votes and share Share DemocraticJohn S TannerWon Democratic 76,803100.0% Scattered write-insName as filed: Writein Write-in 220.0% - Votes for listed candidates
- 183,898
- Election day
- November 5, 1996
- District map
- Older district map (1992 to 2000)
US House, Tennessee District 8, 1996, every candidate Candidate Party Votes and share Share DemocraticJohn S TannerWon Democratic 123,68167.3% RepublicanTom Watson Republican 55,02429.9% IndependentDonna Malone Independent 4,8162.6% Scattered write-insName as filed: Writein Write-in 3770.2% - Votes for listed candidates
- 153,538
- Election day
- November 8, 1994
- District map
- Older district map (1992 to 2000)
US House, Tennessee District 8, 1994, every candidate Candidate Party Votes and share Share DemocraticJohn S TannerWon Democratic 97,95163.8% RepublicanNeal R Morris Republican 55,57336.2% Scattered write-insName as filed: Writein Write-in 140.0% - Votes for listed candidates
- 163,432
- Election day
- November 3, 1992
- District map
- Older district map (1992 to 2000)
US House, Tennessee District 8, 1992, every candidate Candidate Party Votes and share Share DemocraticJohn S TannerWon Democratic 136,85283.7% IndependentLawrence J Barnes Independent 9,6055.9% IndependentDavid L Ward Independent 6,9304.2% IndependentJohn E Vinson Independent 5,4353.3% IndependentMillard J McKissack II Independent 4,6002.8% Scattered write-insName as filed: Writein Write-in 100.0% - Votes for listed candidates
- 62,266
- Election day
- November 6, 1990
- District map
- Older district map (1982 to 1990)
US House, Tennessee District 8, 1990, every candidate Candidate Party Votes and share Share DemocraticJohn S TannerWon Democratic 62,241100.0% Scattered write-insName as filed: Writein Write-in 250.0% - Votes for listed candidates
- 151,465
- Election day
- November 8, 1988
- District map
- Older district map (1982 to 1990)
US House, Tennessee District 8, 1988, every candidate Candidate Party Votes and share Share DemocraticJohn TannerWon Democratic 94,57162.4% RepublicanEd Bryant Republican 56,89337.6% Scattered write-insName as filed: Writein Write-in 10.0% - Votes for listed candidates
- 126,503
- Election day
- November 4, 1986
- District map
- Older district map (1982 to 1990)
US House, Tennessee District 8, 1986, every candidate Candidate Party Votes and share Share DemocraticEd JonesWon Democratic 101,69980.4% RepublicanDan H Campbell Republican 24,79219.6% Scattered write-insName as filed: Writein Write-in 120.0% - Votes for listed candidates
- 118,668
- Election day
- November 6, 1984
- District map
- Older district map (1982 to 1990)
US House, Tennessee District 8, 1984, every candidate Candidate Party Votes and share Share DemocraticEd JonesWon Democratic 118,653100.0% OtherOther Other 150.0% - Votes for listed candidates
- 125,472
- Election day
- November 2, 1982
- District map
- Older district map (1982 to 1990)
US House, Tennessee District 8, 1982, every candidate Candidate Party Votes and share Share DemocraticEd JonesWon Democratic 93,94574.9% RepublicanBruce Benson Republican 31,52725.1% - Votes for listed candidates
- 110,207
- Election day
- November 4, 1980
- District map
- Older district map (1972 to 1980)
US House, Tennessee District 8, 1980, every candidate Candidate Party Votes and share Share DemocraticHarold E FordWon Democratic 110,13999.9% Scattered write-insName as filed: Writein Write-in 680.1% - Votes for listed candidates
- 115,917
- Election day
- November 7, 1978
- District map
- Older district map (1972 to 1980)
US House, Tennessee District 8, 1978, every candidate Candidate Party Votes and share Share DemocraticHarold E FordWon Democratic 80,77669.7% RepublicanDuncan Ragsdale Republican 33,67929.1% IndependentRichard Whitmore Independent 1,4601.3% Scattered write-insName as filed: Writein Write-in 20.0% - Votes for listed candidates
- 165,954
- Election day
- November 2, 1976
- District map
- Older district map (1972 to 1980)
US House, Tennessee District 8, 1976, every candidate Candidate Party Votes and share Share DemocraticHarold E FordWon Democratic 100,68360.7% RepublicanA D "Andy" Allissandratos Republican 63,81938.5% IndependentMark F Flanagan Independent 1,4500.9% Scattered write-insName as filed: Writein Write-in 20.0%
1976 to 2024: MIT Election Data and Science Lab, U.S. House 1976-2024, retrieved Oct 28, 2026. Compiled by MIT Election Data and Science Lab (MEDSL) from official returns; not an official source
Tennessee District 8 was redrawn for 2026, so every row here ran on older lines and covers different territory. The map in force, by state
Download and cite
Cite this page
Election Wrld. (2026). Tennessee District 8, US House results. https://www.electionwrld.com/tn/congress/8. Retrieved October 31, 2026.
Embed this seat
<iframe src="https://www.electionwrld.com/embed/tn/congress/8" title="Tennessee District 8, US House" width="100%" height="400" style="border:0;max-width:640px" loading="lazy"></iframe>
<p style="font-size:13px">Data: <a href="https://www.electionwrld.com">Election Wrld</a>, CC BY 4.0</p>Sources
Sources: MIT Election Data and Science Lab, U.S. House 1976-2024 (CC0 1.0), retrieved Oct 28, 2026, compiled by MIT Election Data and Science Lab (MEDSL) from official returns, not an official source; Census TIGERweb Legislative MapServer (120th CDs layer 0, 119th CDs layer 4, 2026 SLD upper layer 1 and lower layer 2) (US Census Bureau, public domain), retrieved Oct 28, 2026; unitedstates/congress-legislators (current) (CC0-1.0), retrieved Oct 28, 2026, compiled by the @unitedstates project volunteers (rosters from official congressional sources) from official returns, not an official source.
DataState data (JSON)Sources: MIT Election Data and Science Lab, U.S. House 1976-2024, FEC, DIME (ODC-BY), Portraits: unitedstates/images (public domain)Data as of Oct 28, 2026