

Texas Senate
Tue, Nov 3 · Seat held by John Cornyn Republican since Nov 2002 (not a candidate in 2026)
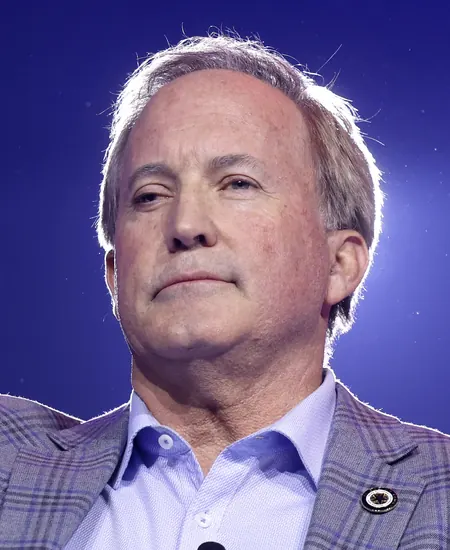
Ken Paxton 46.1James Talarico 48.7
Average of 15 polls, Sep 18 to Oct 28, from VoteHub · how it’s calculated
Newest poll
Newest · ActiVote, field dates Oct 22 to Oct 28, released Oct 30, 400 likely votersPolls fetched Oct 30, 2:02 a.m. ET, from VoteHub

Show all 3 candidates on the ballot
- James TalaricoDemocratic
- Ken PaxtonRepublican
- Ted BrownLibertarian
Showing major-party nominees, incumbents and candidates with 5%+ in the latest poll or comparable fundraising.
Polls over time
52 polls, through Election Day Nov 3Each dot is one published poll. The thick line is the 7-week average, not a forecast. How it’s calculated. All polls. Polls fetched Oct 30, 2:02 a.m. ET, from VoteHub.
The polls in this chart (52)
13 polls released in the last 14 days · latest results range from 48.4–52.1% (D) and 43–49.4% (R) (newest 5 polls on the chart)
Each dot is a poll with both names, 52 of the 60 for this race. Dots and lines follow the field end date. The table adds the day each poll was released.
| Pollster | Field dates | Released | Sample | Talarico | Paxton |
|---|---|---|---|---|---|
| ActiVote | Oct 22 to Oct 28 | Oct 30 | 400 likely voters | 52.1 | 47.9 |
| Quantus Insights | Oct 26 to Oct 28 | Oct 30 | 1,221 likely voters | 48.4 | 49.4 |
| A2 Insights | Oct 23 to Oct 27 | Oct 29 | 631 likely voters | 50.2 | 47.2 |
| CNN/SSRS | Oct 20 to Oct 27 | Oct 29 | 923 likely voters | 49 | 43 |
| Texas Southern University Barbara Jordan Public Policy Research and Survey Center | Oct 21 to Oct 25 | Oct 29 | 2,000 likely voters | 49 | 47 |
| YouGov | Oct 13 to Oct 21 | Oct 27 | 1,000 registered voters | 50 | 45 |
| ActiVote | Oct 17 to Oct 21 | Oct 22 | 400 likely voters | 51 | 49 |
| VoteHub/Verasight | Oct 1 to Oct 20 | Oct 23 | 601 likely voters | 47.6 | 45.2 |
| Beacon Research/Shaw & Co. Research | Oct 15 to Oct 19 | Oct 22 | 1,398 likely voters | 49 | 49 |
| Emerson College | Oct 17 to Oct 19 | Oct 22 | 1,000 likely voters | 48 | 46 |
| Slingshot Strategies | Oct 15 to Oct 18 | Oct 23 | 969 likely voters | 51 | 47 |
| Pollfinity | Oct 15 to Oct 18 | Oct 22 | 278 likely voters | 48 | 43 |
| InsiderAdvantage | Oct 13 to Oct 14 | Oct 16 | 1,200 likely voters | 48 | 49 |
| ActiVote | Sep 30 to Oct 14 | Oct 15 | 400 likely voters | 51.9 | 48.1 |
| Quantus Insights | Oct 9 to Oct 11 | Oct 13 | 854 likely voters | 46.7 | 47.2 |
| ReconMR/Siena University | Oct 5 to Oct 8 | Oct 13 | 617 likely voters | 48 | 44 |
| Guidant Polling and Strategy | Sep 20 to Sep 28 | Oct 8 | 800 likely voters | 46.6 | 44.2 |
| University of Massachusetts Lowell Center for Public Opinion/YouGov | Sep 18 to Sep 28 | Oct 8 | 850 likely voters | 45 | 45 |
| Beacon Research/Shaw & Co. Research | Sep 24 to Sep 28 | Oct 2 | 881 likely voters | 51 | 49 |
| Slingshot Strategies | Sep 19 to Sep 22 | Sep 25 | 1,007 likely voters | 49 | 45 |
| Texas Southern University Barbara Jordan Public Policy Research and Survey Center | Sep 15 to Sep 19 | Sep 22 | 1,800 likely voters | 47 | 46 |
| Emerson College | Sep 12 to Sep 14 | Sep 17 | 1,000 likely voters | 47 | 46 |
| ReconMR/Siena University | Sep 8 to Sep 11 | Sep 17 | 614 likely voters | 49 | 43 |
| InsiderAdvantage | Sep 8 to Sep 9 | Sep 11 | 1,200 likely voters | 47.1 | 45.6 |
| YouGov | Aug 27 to Sep 4 | Sep 10 | 1,000 registered voters | 48 | 43 |
| Fabrizio Ward/Impact Research | Aug 30 to Sep 1 | Sep 10 | 895 likely voters | 48 | 44 |
| Slingshot Strategies | Aug 21 to Aug 24 | Aug 27 | 1,000 likely voters | 48 | 42 |
| The Texas Politics Project at the University of Texas at Austin/YouGov | Aug 5 to Aug 13 | Aug 26 | 1,218 registered voters | 42 | 39 |
| Emerson College | Aug 9 to Aug 10 | Aug 13 | 1,000 likely voters | 46 | 47 |
| YouGov Blue | Jul 15 to Jul 31 | Aug 7 | 1,001 registered voters | 48 | 45 |
| Wedgewood Polls | Jul 30 to Jul 31 | Aug 3 | 800 likely voters | 48 | 46 |
| ReconMR/Siena University | Jul 27 to Jul 30 | Aug 7 | 619 likely voters | 47 | 43 |
| Texas Southern University Barbara Jordan Public Policy Research and Survey Center | Jul 27 to Jul 30 | Aug 4 | 1,200 likely voters | 47 | 45 |
| Beacon Research/Shaw & Co. Research | Jul 23 to Jul 27 | Jul 30 | 1,006 registered voters | 51 | 48 |
| Slingshot Strategies | Jul 15 to Jul 17 | Jul 28 | 1,048 likely voters | 45 | 40 |
| A2 Insights | Jun 23 to Jun 28 | Jul 1 | 618 likely voters | 48.4 | 46.1 |
| The New York Times/Siena University | Jun 19 to Jun 27 | Jun 30 | 656 likely voters | 47 | 47 |
| Texas Politics Project at the University of Texas/YouGov | Jun 5 to Jun 12 | Jun 23 | 1,200 registered voters | 42 | 43 |
| ReconMR/Siena University | Jun 1 to Jun 4 | Jun 9 | 807 likely voters | 47 | 44 |
| Quantus Insights | Jun 3 to Jun 4 | Jun 6 | 800 likely voters | 43 | 45 |
| Slingshot Strategies | May 27 to May 28 | May 29 | 1,670 likely voters | 48 | 45 |
| Public Policy Polling | May 22 to May 23 | May 28 | 643 likely voters | 45 | 38 |
| Texas Southern University Barbara Jordan Public Policy Research and Survey Center | Apr 22 to May 6 | May 18 | 1,223 likely voters | 45 | 45 |
| YouGov | Apr 10 to Apr 20 | Apr 30 | 1,200 registered voters | 42 | 34 |
| Texas Public Opinion Research | Apr 17 to Apr 20 | Apr 28 | 1,018 likely voters | 46 | 41 |
| Impact Research | Mar 12 to Mar 17 | Apr 28 | 900 likely voters | 44 | 43 |
| Public Policy Polling | Mar 4 to Mar 5 | Apr 28 | 576 adults | 47 | 45 |
| University of Houston/YouGov | Jan 20 to Jan 31 | Apr 28 | 1,502 likely voters | 44 | 46 |
| Emerson College | Jan 10 to Jan 12 | Apr 28 | 1,165 registered voters | 45.6 | 45.6 |
| Ragnar Research Partners | Nov 12 to Nov 17 | Apr 28 | 1,000 likely voters | 44 | 44 |
| University of Houston/Texas Southern University | Sep 19 to Oct 1 | Apr 28 | 1,650 registered voters | 46 | 49 |
| University of Texas at Tyler | Sep 17 to Sep 24 | Apr 28 | 1,032 registered voters | 37 | 38 |
Polls left off the chart (8 of 60)
| Poll | Why it is not on the chart |
|---|---|
| Texas Public Opinion ResearchApr 17 to Apr 20 | Names fewer than two candidates on this ballot (lists John Cornyn, James Talarico) |
| YouGovApr 10 to Apr 12 | Names fewer than two candidates on this ballot (lists John Cornyn, James Talarico) |
| Public Policy PollingMar 4 to Mar 5 | Names fewer than two candidates on this ballot (lists John Cornyn, James Talarico) |
| University of Houston/YouGovJan 20 to Jan 31 | Names fewer than two candidates on this ballot (lists John Cornyn, James Talarico) |
| Emerson CollegeJan 10 to Jan 12 | Names fewer than two candidates on this ballot (lists John Cornyn, James Talarico) |
| Ragnar Research PartnersNov 12 to Nov 17 | Names fewer than two candidates on this ballot (lists John Cornyn, James Talarico) |
| University of Houston/Texas Southern UniversitySep 19 to Oct 1 | Names fewer than two candidates on this ballot (lists John Cornyn, James Talarico) |
| University of Texas at TylerSep 17 to Sep 24 | Names fewer than two candidates on this ballot (lists John Cornyn, James Talarico) |
Side by side
Paxton left, Talarico right- Total receipts, 2025-2026 cycle, through Oct 14
- $22.3M
- $146.3M
- Cash on hand
- $4.8M
- $9.9M
- Age on Election Day
- 63
- 37
Ken Paxton on fec.gov. James Talarico on fec.gov. One or more are matched to the FEC by name, party and seat, so a total could belong to someone else.
How these are counted
Total receipts line of each candidate’s principal campaign committee, 2025-2026 cycle. Other sites may show career, six-year or all-committee totals, which differ.
What changed in this race
Newest firstNEW POLLTexas Senate
Texas Senate: James Talarico 52.1, Ken Paxton 47.9
ActiVote, Oct 22 to Oct 28, 400 likely voters · via VoteHub (CC BY 4.0)
NEW POLLTexas Senate
Texas Senate: Ken Paxton 49.4, James Talarico 48.4
Quantus Insights, Oct 26 to Oct 28, 1,221 likely voters · via VoteHub (CC BY 4.0)
More about this race
Candidates on the ballot
- James TalaricoDemocratic
- Ken PaxtonRepublican
- Ted BrownLibertarian
Source: sos.state.tx.us (PDF), dated Aug 28
Seat on the ballot, shift from 2014 to 2020: 17.6 points toward Democrats (Republican by 27.2 in 2014, Republican by 9.6 in 2020).
Vote in Texas
- Register
- Registration, polling place, sample ballot lookup, election office
- Mail ballot status
- ID rules
Trouble voting? Election Protection hotline: 866-OUR-VOTE. A nonpartisan coalition of civil-rights and voting-rights groups, not a government service. 866ourvote.org
History (17 elections for this seat)
- Votes for listed candidates
- 11,291,854
- Election day
- November 5, 2024
US Senate, Texas, 2024, every candidate Candidate Party Votes and share Share RepublicanTed CruzWon Republican 5,990,74153.1% DemocraticColin Allred Democratic 5,031,24944.6% LibertarianTed Brown Libertarian 267,0392.4% OtherOther Other 2,8250.0% - Votes for listed candidates
- 11,144,040
- Election day
- November 3, 2020
US Senate, Texas, 2020, every candidate Candidate Party Votes and share Share RepublicanJohn CornynWon Republican 5,962,98353.5% DemocraticMary "MJ" Hegar Democratic 4,888,76443.9% LibertarianKerry Douglas McKennon Libertarian 209,7221.9% GreenDavid B. Collins Green 81,8930.7% OtherRicardo Turullols-Bonilla Other 6780.0% - Votes for listed candidates
- 8,371,655
- Election day
- November 6, 2018
US Senate, Texas, 2018, every candidate Candidate Party Votes and share Share RepublicanTed CruzWon Republican 4,260,55350.9% DemocraticBeto O'Rourke Democratic 4,045,63248.3% LibertarianNeal M. Dikeman Libertarian 65,4700.8% - Votes for listed candidates
- 4,648,358
- Election day
- November 4, 2014
US Senate, Texas, 2014, every candidate Candidate Party Votes and share Share RepublicanJohn CornynWon Republican 2,861,53161.6% DemocraticDavid M. Alameel Democratic 1,597,38734.4% LibertarianRebecca Paddock Libertarian 133,7512.9% GreenEmily "Spicybrown" Sanchez Green 54,7011.2% Scattered write-ins Write-in 9880.0% - Votes for listed candidates
- 7,864,822
- Election day
- November 6, 2012
US Senate, Texas, 2012, every candidate Candidate Party Votes and share Share RepublicanTed CruzWon Republican 4,440,13756.5% DemocraticPaul Sadler Democratic 3,194,92740.6% LibertarianJohn Jay Myers Libertarian 162,3542.1% GreenDavid B. Collins Green 67,4040.9% - Votes for listed candidates
- 7,912,075
- Election day
- November 4, 2008
US Senate, Texas, 2008, every candidate Candidate Party Votes and share Share RepublicanJohn CornynWon Republican 4,337,46954.8% DemocraticRichard J. "Rick" Noriega Democratic 3,389,36542.8% LibertarianYvonne Adams Schick Libertarian 185,2412.3% - Votes for listed candidates
- 4,314,663
- Election day
- November 7, 2006
US Senate, Texas, 2006, every candidate Candidate Party Votes and share Share RepublicanKay Bailey HutchisonWon Republican 2,661,78961.7% DemocraticBarbara Ann Radnofsky Democratic 1,555,20236.0% LibertarianScott Lanier Jameson Libertarian 97,6722.3% - Votes for listed candidates
- 4,514,012
- Election day
- November 5, 2002
US Senate, Texas, 2002, every candidate Candidate Party Votes and share Share RepublicanJohn CornynWon Republican 2,496,24355.3% DemocraticRon Kirk Democratic 1,955,75843.3% LibertarianScott Lanier Jameson Libertarian 35,5380.8% GreenRoy H. Williams Green 25,0510.6% Scattered write-ins Write-in 1,4220.0% - Votes for listed candidates
- 6,267,964
- Election day
- November 7, 2000
US Senate, Texas, 2000, every candidate Candidate Party Votes and share Share RepublicanKay Bailey HutchisonWon Republican 4,078,95465.1% DemocraticGene Kelly Democratic 2,025,02432.3% GreenDouglas S. Sandage Green 91,3291.5% LibertarianMary J. Ruwart Libertarian 72,6571.2% - Votes for listed candidates
- 5,527,441
- Election day
- November 5, 1996
US Senate, Texas, 1996, every candidate Candidate Party Votes and share Share RepublicanPhil GrammWon Republican 3,027,68054.8% DemocraticVictor M. Morales Democratic 2,428,77643.9% LibertarianMichael Bird Libertarian 51,5160.9% OtherJohn Huff Other 19,4690.4% - Votes for listed candidates
- 4,279,940
- Election day
- November 8, 1994
US Senate, Texas, 1994, every candidate Candidate Party Votes and share Share RepublicanKay Bailey HutchisonWon Republican 2,604,21860.8% DemocraticRichard Fisher Democratic 1,639,61538.3% LibertarianPierre Blondeau Libertarian 36,1070.8% - Votes for listed candidates
- 3,822,157
- Election day
- November 6, 1990
US Senate, Texas, 1990, every candidate Candidate Party Votes and share Share RepublicanPhil GrammWon Republican 2,302,35760.2% DemocraticHugh Parmer Democratic 1,429,98637.4% LibertarianGary Johnson Libertarian 89,0892.3% Scattered write-ins Write-in 7250.0% - Votes for listed candidates
- 5,323,606
- Election day
- November 8, 1988
US Senate, Texas, 1988, every candidate Candidate Party Votes and share Share DemocraticLloyd BentsenWon Democratic 3,149,80659.2% RepublicanBeau Boulter Republican 2,129,22840.0% LibertarianJeff Daiell Libertarian 43,9890.8% Scattered write-ins Write-in 5830.0% - Votes for listed candidates
- 5,314,178
- Election day
- November 6, 1984
US Senate, Texas, 1984, every candidate Candidate Party Votes and share Share RepublicanPhil GrammWon Republican 3,111,34858.5% DemocraticLloyd Doggett Democratic 2,202,55741.4% OtherOther Other 2730.0% - Votes for listed candidates
- 3,103,167
- Election day
- November 2, 1982
US Senate, Texas, 1982, every candidate Candidate Party Votes and share Share DemocraticLloyd BentsenWon Democratic 1,818,22358.6% RepublicanJim Collins Republican 1,256,75940.5% LibertarianJohn E. Ford Libertarian 23,4940.8% OtherLineaus Hooper Lorette Other 4,5640.1% Scattered write-ins Write-in 1270.0% - Votes for listed candidates
- 2,312,540
- Election day
- November 7, 1978
US Senate, Texas, 1978, every candidate Candidate Party Votes and share Share RepublicanJohn G. TowerWon Republican 1,151,37649.8% DemocraticRobert Krueger Democratic 1,139,14949.3% OtherLuis A. Diaz De Loen Other 17,8690.8% OtherMiguel Pendas Other 4,0180.2% OtherOther Other 1280.0% - Votes for listed candidates
- 3,874,230
- Election day
- November 2, 1976
US Senate, Texas, 1976, every candidate Candidate Party Votes and share Share DemocraticLloyd BentsenWon Democratic 2,199,95656.8% RepublicanAlan Steelman Republican 1,636,37042.2% OtherPedro Vasquez Other 20,5490.5% OtherMarjorie P. Gallion Other 17,3550.4%
All rows: MIT Election Data and Science Lab, U.S. Senate statewide 1976-2024, retrieved Oct 28, 2026
Download and cite
Cite this page
Election Wrld. (2026). US Senate in Texas, election results. https://www.electionwrld.com/tx/us-senate. Retrieved October 30, 2026.
Sources
Sources
- Used for
- Senate class (I, II, III) of each state seat; only state and class fields used
- License
- US government work, public domain
- Retrieved
- October 28, 2026
- Link
- https://www.senate.gov/general/contact_information/senators_cfm.xml
- Used for
- web/data/results/senate/{ST}.json. File 1976-2024-senate-state.csv downloaded from the Dataverse access API, sha256 6f745db1b4a0026ad837e74428f9ed6f3f77fa51eb6f858b58ebdbc186fdb3bd; matches the Dataverse-listed md5 0f8b51cf0f77a2ef0bff992f7a64d1b4 (dataset version 8).
- License
- CC0 1.0
- Retrieved
- October 28, 2026
- Link
- https://doi.org/10.7910/DVN/PEJ5QU
- Used for
- web/data/officials/congress.json (name, party, bioguide, official site, service start) and web/data/people (birth year, committees, social media handles and profile links; links only, nothing copied from the platforms). As-of: the files saved in data/raw/people on 2026-10-29.
- License
- CC0-1.0
- Retrieved
- October 28, 2026
- Link
- https://unitedstates.github.io/congress-legislators/legislators-current.json
DataState data (JSON)Sources: MIT Election Data and Science Lab, U.S. Senate statewide 1976-2024, VoteHub polls (CC BY 4.0), FEC, Photo of James Talarico: Antonioaesparza, CC BY-SA 4.0 (cropped), Photo of Ken Paxton: Gage Skidmore, CC BY-SA 4.0 (cropped)Data as of Oct 28, 2026

