

Massachusetts District 8
Tue, Nov 3 · Seat held by Stephen F. Lynch Democratic since Oct 2001
Robert G. Burke 29.4Stephen F. Lynch 70.4
Last result · 2024 generalNo published poll names both candidates.
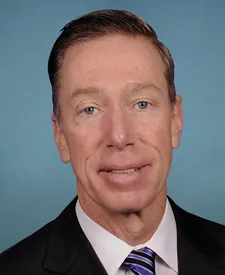
Show all 3 candidates on the ballot
- Stephen F. LynchIncumbentDemocratic
- Robert G. BurkeRepublican
- Rasheed Nicholas WaltersIndependent
Showing major-party nominees, incumbents and candidates with 5%+ in the latest poll or comparable fundraising.
- Last election
- Stephen F. Lynch (Democratic) won by 41.0 points, 2024
- Margin since 2022
- 1.4 points toward Democrats
- On the 2026 ballot
- 3 candidates
Side by side
Burke left, Lynch right- Total receipts, 2025-2026 cycle, through Oct 14
- No FEC report
- $1.1M
- Cash on hand
- No FEC report
- $494K
- Donor-based spectrum
- LiberalCentristConservativeLynchNo published score for Burke
- Record
- 0-2
- 13-0
- Years in politics
- Not available
- 25
- Age on Election Day
- Not available
- 71
How these are counted
Total receipts line of each candidate’s principal campaign committee, 2025-2026 cycle. Other sites may show career, six-year or all-committee totals, which differ. The spectrum is a published research score, not our rating. How this works. Record is wins and losses in the races in our results files, the same count as each profile.
More about this race
Candidates on the ballot
- Stephen F. LynchIncumbentDemocratic
- Robert G. BurkeRepublican
- Rasheed Nicholas WaltersIndependent
Source: sec.state.ma.us, dated Oct 28
Shift since 2022: 1.4 points toward Democrats (Democratic by 39.6 in 2022, Democratic by 41.0 in 2024).
All Massachusetts districts
- D 15+ pts
- D 5 to 15 pts
- D under 5 pts
- R under 5 pts
- R 5 to 15 pts
- R 15+ pts
- Other winner
- No data
Show these districts as a list (9)
- Massachusetts District 1· Richard E. Neal (D), Democratic by 25.1 points, 2024
- Massachusetts District 2· James P. McGovern (D), Democratic by 37.5 points, 2024
- Massachusetts District 3· Lori Trahan (D), Democratic by 95.0 points, 2024
- Massachusetts District 4· Jake Auchincloss (D), Democratic by 94.8 points, 2024
- Massachusetts District 5· Katherine M. Clark (D), Democratic by 96.4 points, 2024
- Massachusetts District 6· Seth Moulton (D), Democratic by 95.6 points, 2024
- Massachusetts District 7· Ayanna Pressley (D), Democratic by 94.2 points, 2024
- Massachusetts District 8· Stephen F. Lynch (D), Democratic by 41.0 points, 2024
- Massachusetts District 9· William R. Keating (D), Democratic by 13.0 points, 2024
Map settings
Vote in Massachusetts
Trouble voting? Election Protection hotline: 866-OUR-VOTE. A nonpartisan coalition of civil-rights and voting-rights groups, not a government service. 866ourvote.org
Official results for Massachusetts
History (25 elections for this seat)
- Votes for listed candidates
- 376,830
- Election day
- November 5, 2024
- District map
- Same as today
US House, Massachusetts District 8, 2024, every candidate Candidate Party Votes and share Share DemocraticStephen F. LynchWon Democratic 265,43270.4% RepublicanRobert G. Burke Republican 110,63829.4% OtherAll Others Other 7600.2% - Votes for listed candidates
- 272,564
- Election day
- November 8, 2022
- District map
- Same as today
US House, Massachusetts District 8, 2022, every candidate Candidate Party Votes and share Share DemocraticStephen F. LynchWon Democratic 189,98769.7% RepublicanRobert G. Burke Republican 82,12630.1% OtherAll Others Other 4510.2% - Votes for listed candidates
- 385,401
- Election day
- November 3, 2020
- District map
- Older district map (2012 to 2020)
US House, Massachusetts District 8, 2020, every candidate Candidate Party Votes and share Share DemocraticStephen F. LynchWon Democratic 310,94080.7% IndependentJonathan D Lott Independent 72,06018.7% Scattered write-insName as filed: Writein Write-in 2,4010.6% - Votes for listed candidates
- 263,307
- Election day
- November 6, 2018
- District map
- Older district map (2012 to 2020)
US House, Massachusetts District 8, 2018, every candidate Candidate Party Votes and share Share DemocraticStephen F. LynchWon Democratic 259,15998.4% Scattered write-insName as filed: Writein Write-in 4,1481.6% - Votes for listed candidates
- 374,265
- Election day
- November 8, 2016
- District map
- Older district map (2012 to 2020)
US House, Massachusetts District 8, 2016, every candidate Candidate Party Votes and share Share DemocraticStephen F. LynchWon Democratic 271,01972.4% RepublicanWilliam Burke Republican 102,74427.5% OtherOther Other 5020.1% - Votes for listed candidates
- 203,351
- Election day
- November 4, 2014
- District map
- Older district map (2012 to 2020)
US House, Massachusetts District 8, 2014, every candidate Candidate Party Votes and share Share DemocraticStephen F. LynchWon Democratic 200,64498.7% OtherOther Other 2,7071.3% - Votes for listed candidates
- 346,811
- Election day
- November 6, 2012
- District map
- Older district map (2012 to 2020)
US House, Massachusetts District 8, 2012, every candidate Candidate Party Votes and share Share DemocraticStephen F. LynchWon Democratic 263,99976.1% RepublicanJoe Selvaggi Republican 82,24223.7% OtherOther Other 5700.2% - Votes for listed candidates
- 137,660
- Election day
- November 2, 2010
- District map
- Older district map (2002 to 2010)
US House, Massachusetts District 8, 2010, every candidate Candidate Party Votes and share Share DemocraticMichael E CapuanoWon Democratic 134,97498.0% OtherOther Other 2,6862.0% - Votes for listed candidates
- 188,252
- Election day
- November 4, 2008
- District map
- Older district map (2002 to 2010)
US House, Massachusetts District 8, 2008, every candidate Candidate Party Votes and share Share DemocraticMichael E CapuanoWon Democratic 185,53098.6% OtherOther Other 2,7221.4% - Votes for listed candidates
- 138,455
- Election day
- November 7, 2006
- District map
- Older district map (2002 to 2010)
US House, Massachusetts District 8, 2006, every candidate Candidate Party Votes and share Share DemocraticMichael E CapuanoWon Democratic 125,51590.7% OtherLaura Garza Other 12,4499.0% OtherOther Other 4910.4% - Votes for listed candidates
- 168,081
- Election day
- November 2, 2004
- District map
- Older district map (2002 to 2010)
US House, Massachusetts District 8, 2004, every candidate Candidate Party Votes and share Share DemocraticMichael E CapuanoWon Democratic 165,85298.7% OtherOther Other 2,2291.3% - Votes for listed candidates
- 112,381
- Election day
- November 5, 2002
- District map
- Older district map (2002 to 2010)
US House, Massachusetts District 8, 2002, every candidate Candidate Party Votes and share Share DemocraticMichael E CapuanoWon Democratic 111,86199.5% OtherOther Other 4950.4% Scattered write-insName as filed: Writein Write-in 250.0% - Votes for listed candidates
- 145,072
- Election day
- November 7, 2000
- District map
- Older district map (1992 to 2000)
US House, Massachusetts District 8, 2000, every candidate Candidate Party Votes and share Share DemocraticMichael E CapuanoWon Democratic 144,03199.3% OtherOther Other 1,0410.7% - Votes for listed candidates
- 121,887
- Election day
- November 3, 1998
- District map
- Older district map (1992 to 2000)
US House, Massachusetts District 8, 1998, every candidate Candidate Party Votes and share Share DemocraticMichael E CapuanoWon Democratic 99,60381.7% RepublicanPhilip Hyde III Republican 14,12511.6% OtherAndrea Morell Other 4,8544.0% IndependentAnthony A Schinella Independent 3,1292.6% OtherOther Other 1760.1% - Votes for listed candidates
- 174,620
- Election day
- November 5, 1996
- District map
- Older district map (1992 to 2000)
US House, Massachusetts District 8, 1996, every candidate Candidate Party Votes and share Share DemocraticJoseph P Kennedy IIWon Democratic 147,12684.3% RepublicanR Philip Hyde Republican 27,30315.6% OtherOther Other 1910.1% - Votes for listed candidates
- 114,423
- Election day
- November 8, 1994
- District map
- Older district map (1992 to 2000)
US House, Massachusetts District 8, 1994, every candidate Candidate Party Votes and share Share DemocraticJoseph P Kennedy IIWon Democratic 113,22499.0% OtherOther Other 1,1991.0% - Votes for listed candidates
- 180,484
- Election day
- November 3, 1992
- District map
- Older district map (1992 to 2000)
US House, Massachusetts District 8, 1992, every candidate Candidate Party Votes and share Share DemocraticJoseph P Kennedy IIWon Democratic 149,90383.1% IndependentAlice Harriett Nakash Independent 30,40216.8% OtherOther Other 1790.1% - Votes for listed candidates
- 186,407
- Election day
- November 6, 1990
- District map
- Older district map (1982 to 1990)
US House, Massachusetts District 8, 1990, every candidate Candidate Party Votes and share Share DemocraticJoseph P Kennedy IIWon Democratic 125,47967.3% RepublicanGlenn W Fiscus Republican 39,31021.1% OtherOther Other 12,8126.9% OtherSusan C Davies Other 8,8064.7% - Votes for listed candidates
- 206,189
- Election day
- November 8, 1988
- District map
- Older district map (1982 to 1990)
US House, Massachusetts District 8, 1988, every candidate Candidate Party Votes and share Share DemocraticJoseph P Kennedy IIWon Democratic 165,74580.4% RepublicanGlenn W Fiscus Republican 40,31619.6% OtherOther Other 1280.1% - Votes for listed candidates
- 154,984
- Election day
- November 4, 1986
- District map
- Older district map (1982 to 1990)
US House, Massachusetts District 8, 1986, every candidate Candidate Party Votes and share Share DemocraticJoseph P Kennedy IIWon Democratic 104,65167.5% RepublicanClark C Abt Republican 40,25926.0% OtherOther Other 10,0746.5% - Votes for listed candidates
- 195,603
- Election day
- November 6, 1984
- District map
- Older district map (1982 to 1990)
US House, Massachusetts District 8, 1984, every candidate Candidate Party Votes and share Share DemocraticThomas P O'Neill JrWon Democratic 179,61791.8% OtherLaura Ross Other 15,8108.1% OtherOther Other 1760.1% - Votes for listed candidates
- 164,672
- Election day
- November 2, 1982
- District map
- Older district map (1982 to 1990)
US House, Massachusetts District 8, 1982, every candidate Candidate Party Votes and share Share DemocraticThomas P O'Neil JrWon Democratic 123,29674.9% RepublicanFrank Luke McNamara Jr Republican 41,37025.1% Scattered write-insName as filed: Writein Write-in 60.0% - Votes for listed candidates
- 164,183
- Election day
- November 4, 1980
- District map
- Older district map (1972 to 1980)
US House, Massachusetts District 8, 1980, every candidate Candidate Party Votes and share Share DemocraticThomas P O'Neill JrWon Democratic 128,68978.4% RepublicanWilliam A Barnstead Republican 35,47721.6% Scattered write-insName as filed: Writein Write-in 170.0% - Votes for listed candidates
- 136,928
- Election day
- November 7, 1978
- District map
- Older district map (1972 to 1980)
US House, Massachusetts District 8, 1978, every candidate Candidate Party Votes and share Share DemocraticThomas P O'Neill JrWon Democratic 102,16074.6% RepublicanWilliam A Barnstead Republican 28,56620.9% OtherLaura M Ross Other 6,1934.5% OtherOther Other 90.0% - Votes for listed candidates
- 178,850
- Election day
- November 2, 1976
- District map
- Older district map (1972 to 1980)
US House, Massachusetts District 8, 1976, every candidate Candidate Party Votes and share Share DemocraticThomas P O'Neil JrWon Democratic 133,13174.4% RepublicanWilliam A Barnstead Republican 33,43718.7% IndependentFlorenzo Di Donato Independent 8,2334.6% OtherLeo F Kahian Other 4,0222.2% Scattered write-insName as filed: Writein Write-in 270.0%
All rows: MIT Election Data and Science Lab, U.S. House 1976-2024, retrieved Oct 28, 2026
District numbers are reused after each redistricting, so rows on older lines cover different territory than today's Massachusetts District 8.
Download and cite
Cite this page
Election Wrld. (2026). Massachusetts District 8, US House results. https://www.electionwrld.com/ma/congress/8. Retrieved October 30, 2026.
Embed this seat
<iframe src="https://www.electionwrld.com/embed/ma/congress/8" title="Massachusetts District 8, US House" width="100%" height="400" style="border:0;max-width:640px" loading="lazy"></iframe>
<p style="font-size:13px">Data: <a href="https://www.electionwrld.com">Election Wrld</a>, CC BY 4.0</p>Sources
Sources
- Used for
- web/data/results/house/{ST}.json. The Dataverse API refuses this file behind a guestbook, so the identical file was taken from two public GitHub copies (Hackquantumcpp/snoutcounter-midterms-2026-model data/1976-2024-house.csv and sta199-f26/sta199-f26.github.io _data/gerrymander/1976-2024-house.tab), which are byte-identical to each other and match the md5 a9566ac393913a1af343284e837c17bb that Dataverse lists for dataset version 15.0 (2026-03-09). sha256 76eec42483ee9f0fc5cf6e377442c783d1ae6eefa929729fd6561a69bab47f2a.
- License
- CC0 1.0
- Retrieved
- October 28, 2026
- Link
- https://doi.org/10.7910/DVN/IG0UN2
- Used for
- cd.topo.json, sld/*.topo.json
- License
- US Census Bureau, public domain
- Retrieved
- October 28, 2026
- Link
- https://tigerweb.geo.census.gov/arcgis/rest/services/TIGERweb/Legislative/MapServer
- Used for
- web/data/officials/congress.json (name, party, bioguide, official site, service start) and web/data/people (birth year, committees, social media handles and profile links; links only, nothing copied from the platforms). As-of: the files saved in data/raw/people on 2026-10-29.
- License
- CC0-1.0
- Retrieved
- October 28, 2026
- Link
- https://unitedstates.github.io/congress-legislators/legislators-current.json
DataState data (JSON)Sources: MIT Election Data and Science Lab, U.S. House 1976-2024, FEC, DIME (ODC-BY), Portraits: unitedstates/images (public domain)Data as of Oct 28, 2026