

New Jersey District 1
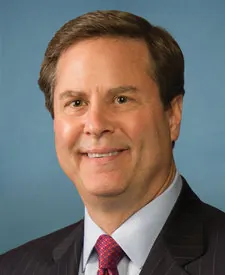
Tue, Nov 3 · Seat held by Donald Norcross Democratic since Nov 2014
No published poll names both candidates.Last result · 2024 general: Donald Norcross (D) 57.8, Theodore "Teddy" Liddell (R) 40.0, Robin Brownfield (G) 1.6
- Last election
- Donald Norcross (Democratic) won by 17.8 points, 2024
- Margin since 2022
- 9.3 points toward Republicans
- On the 2026 ballot
- 2 candidates
Side by side
Left column: GaldoRight column: Norcross
- Total receipts, 2025-2026 cycle, through Oct 14
- $16K
- $2.0M
- Cash on hand
- $772
- $2.4M
- Donor-based spectrum
- LiberalCentristConservativeGaldoNorcross
- Races
- Won 0 of 1
- Won 10 of 10
- Years since first win
- Not available
- 12
- Age on Election Day
- Not available
- 67
Money: FEC bulk data, through Oct 14. One or more are matched to the FEC by name, party and seat, so a total could belong to someone else.
How these are counted
Total receipts line of each candidate’s principal campaign committee, 2025-2026 cycle. Other sites may show career, six-year or all-committee totals, which differ. Galdo: $16,220 received, $772 cash on hand. Norcross: $1,950,973 received, $2,364,759 cash on hand. The spectrum is a published research score, not our rating. How this works. Wins and losses count the races in our results files, the same as each profile.
More about this race
Candidates on the ballot
- Donald NorcrossIncumbentDemocratic
- Damon GaldoRepublican
Source: nj.gov (PDF), dated Sep 4
Shift since 2022: 9.3 points toward Republicans (Democratic by 27.1 in 2022, Democratic by 17.8 in 2024).
All New Jersey districts
- D 15+ pts
- D 5 to 15 pts
- D under 5 pts
- R under 5 pts
- R 5 to 15 pts
- R 15+ pts
- Other winner
- No data
Show these districts as a list (12)
- New Jersey District 1· Donald Norcross (D), Democratic by 17.8 points, 2024
- New Jersey District 2· Jefferson Van Drew (R), Republican by 16.9 points, 2024
- New Jersey District 3· Herbert C. Conaway, Jr. (D), Democratic by 8.5 points, 2024
- New Jersey District 4· Christopher H. Smith (R), Republican by 35.7 points, 2024
- New Jersey District 5· Josh Gottheimer (D), Democratic by 11.3 points, 2024
- New Jersey District 6· Frank Pallone, Jr. (D), Democratic by 15.8 points, 2024
- New Jersey District 7· Thomas H. Kean, Jr. (R), Republican by 5.4 points, 2024
- New Jersey District 8· Robert Menendez (D), Democratic by 24.6 points, 2024
- New Jersey District 9· Nellie Pou (D), Democratic by 4.9 points, 2024
- New Jersey District 10· LaMonica McIver (D), Democratic by 52.2 points, 2024
- New Jersey District 11· Mikie Sherrill (D), Democratic by 14.7 points, 2024
- New Jersey District 12· Bonnie Watson Coleman (D), Democratic by 24.8 points, 2024
Map settings
Vote in New Jersey
Trouble voting? Election Protection hotline: 866-OUR-VOTE. A nonpartisan coalition of civil-rights and voting-rights groups, not a government service. 866ourvote.org
Official results for New Jersey
History (25 elections for this seat)
- Votes for listed candidates
- 361,060
- Election day
- November 5, 2024
- District map
- Same as today
US House, New Jersey District 1, 2024, every candidate Candidate Party Votes and share Share DemocraticDonald NorcrossWon Democratic 208,80857.8% RepublicanTheodore "Teddy" Liddell Republican 144,39040.0% GreenRobin Brownfield Green 5,7711.6% OtherAustin Johnson Other 2,0910.6% - Votes for listed candidates
- 223,884
- Election day
- November 8, 2022
- District map
- Same as today
US House, New Jersey District 1, 2022, every candidate Candidate Party Votes and share Share DemocraticDonald NorcrossWon Democratic 139,55962.3% RepublicanClaire Gustafson Republican 78,79435.2% OtherPatricia Kline Other 3,3431.5% LibertarianIsaiah Fletcher Libertarian 1,5460.7% OtherAllen J Cannon Other 6420.3% - Votes for listed candidates
- 385,030
- Election day
- November 3, 2020
- District map
- Older district map (2012 to 2020)
US House, New Jersey District 1, 2020, every candidate Candidate Party Votes and share Share DemocraticDonald NorcrossWon Democratic 240,56762.5% RepublicanClaire H Gustafson Republican 144,46337.5% - Votes for listed candidates
- 263,418
- Election day
- November 6, 2018
- District map
- Older district map (2012 to 2020)
US House, New Jersey District 1, 2018, every candidate Candidate Party Votes and share Share DemocraticDonald NorcrossWon Democratic 169,62864.4% RepublicanPaul E Dilks Republican 87,61733.3% LibertarianRobert Shapiro Libertarian 2,8211.1% OtherPaul Hamlin Other 2,3680.9% OtherMohammad Kabir Other 9840.4% - Votes for listed candidates
- 305,473
- Election day
- November 8, 2016
- District map
- Older district map (2012 to 2020)
US House, New Jersey District 1, 2016, every candidate Candidate Party Votes and share Share DemocraticDonald NorcrossWon Democratic 183,23160.0% RepublicanBob Patterson Republican 112,38836.8% OtherScot John Tomaszewski Other 5,4731.8% LibertarianWilliam F Sihr IV Libertarian 2,4100.8% OtherMichael Berman Other 1,9710.6% - Votes for listed candidates
- 162,492
- Election day
- November 4, 2014
- District map
- Older district map (2012 to 2020)
US House, New Jersey District 1, 2014, every candidate Candidate Party Votes and share Share DemocraticDonald NorcrossWon Democratic 93,31557.4% RepublicanGarry W Cobb Republican 64,07339.4% OtherScot John Tomaszewski Other 1,7841.1% OtherRobert Shapiro Other 1,1340.7% OtherMargaret M Chapman Other 1,1030.7% OtherMike Berman Other 6340.4% OtherDonald E Letton Other 4490.3% - Votes for listed candidates
- 308,519
- Election day
- November 6, 2012
- District map
- Older district map (2012 to 2020)
US House, New Jersey District 1, 2012, every candidate Candidate Party Votes and share Share DemocraticRobert E AndrewsWon Democratic 210,47068.2% RepublicanGregory W Horton Republican 92,45930.0% GreenJohn William Reitter Green 4,4131.4% OtherMargaret Chapman Other 1,1770.4% - Votes for listed candidates
- 168,267
- Election day
- November 2, 2010
- District map
- Older district map (2002 to 2010)
US House, New Jersey District 1, 2010, every candidate Candidate Party Votes and share Share DemocraticRobert E AndrewsWon Democratic 106,33463.2% RepublicanDale Glading Republican 58,56234.8% GreenMark Heacock Green 1,5930.9% OtherMargaret M Chapman Other 1,2570.7% OtherNicky I Petrutz Other 5210.3% - Votes for listed candidates
- 285,157
- Election day
- November 4, 2008
- District map
- Older district map (2002 to 2010)
US House, New Jersey District 1, 2008, every candidate Candidate Party Votes and share Share DemocraticRobert E AndrewsWon Democratic 206,45372.4% RepublicanDale M Glading Republican 74,00126.0% GreenMatthew Thieke Green 1,9270.7% OtherMargaret M Chapman Other 1,2580.4% OtherEveritt M Williams III Other 1,0100.4% OtherAlvin Lindsay Jr Other 5080.2% - Votes for listed candidates
- 140,110
- Election day
- November 7, 2006
- District map
- Older district map (2002 to 2010)
US House, New Jersey District 1, 2006, every candidate Candidate Party Votes and share Share DemocraticRobert E AndrewsWon Democratic 140,110100.0% - Votes for listed candidates
- 268,203
- Election day
- November 2, 2004
- District map
- Older district map (2002 to 2010)
US House, New Jersey District 1, 2004, every candidate Candidate Party Votes and share Share DemocraticRobert E AndrewsWon Democratic 201,16375.0% RepublicanS Daniel Hutchison Republican 66,10924.6% IndependentArturo Fulvio Croce Independent 9310.3% - Votes for listed candidates
- 131,389
- Election day
- November 5, 2002
- District map
- Older district map (2002 to 2010)
US House, New Jersey District 1, 2002, every candidate Candidate Party Votes and share Share DemocraticRobert E AndrewsWon Democratic 121,84692.7% LibertarianTimothy Haas Libertarian 9,5437.3% - Votes for listed candidates
- 219,612
- Election day
- November 7, 2000
- District map
- Older district map (1992 to 2000)
US House, New Jersey District 1, 2000, every candidate Candidate Party Votes and share Share DemocraticRobert E AndrewsWon Democratic 167,32776.2% RepublicanCharlene Cathcart Republican 46,45521.2% IndependentCatherine L Parrish Independent 3,0901.4% IndependentEdward Forchion Independent 1,9590.9% IndependentJoseph A Patalivo Independent 7810.4% - Votes for listed candidates
- 123,342
- Election day
- November 3, 1998
- District map
- Older district map (1992 to 2000)
US House, New Jersey District 1, 1998, every candidate Candidate Party Votes and share Share DemocraticRobert E AndrewsWon Democratic 90,27973.2% RepublicanRonald L Richards Republican 27,85522.6% IndependentDavid E West Jr Independent 1,6841.4% IndependentJoesph W Stockman Independent 1,3241.1% IndependentEdward "Rob" Forchion Independent 1,2571.0% IndependentJames E Barber Independent 9430.8% - Votes for listed candidates
- 210,734
- Election day
- November 5, 1996
- District map
- Older district map (1992 to 2000)
US House, New Jersey District 1, 1996, every candidate Candidate Party Votes and share Share DemocraticRobert E AndrewsWon Democratic 160,41376.1% RepublicanMel Suplee Republican 44,28721.0% IndependentMichael Edmondson Independent 2,6681.3% IndependentPatricia A Bily Independent 1,8730.9% IndependentNorman E Wahner Independent 1,4930.7% - Votes for listed candidates
- 149,660
- Election day
- November 8, 1994
- District map
- Older district map (1992 to 2000)
US House, New Jersey District 1, 1994, every candidate Candidate Party Votes and share Share DemocraticRobert E AndrewsWon Democratic 108,15572.3% RepublicanJames N Hogan Republican 41,50527.7% - Votes for listed candidates
- 228,072
- Election day
- November 3, 1992
- District map
- Older district map (1992 to 2000)
US House, New Jersey District 1, 1992, every candidate Candidate Party Votes and share Share DemocraticRobert E AndrewsWon Democratic 153,52567.3% RepublicanLee A Solomon Republican 65,12328.6% OtherJames E Smith Other 3,7611.6% LibertarianJerry Zeldin Libertarian 2,6411.2% OtherKenneth L Lowndes Other 2,1630.9% OtherNicholas Pastuch Other 8590.4% - Votes for listed candidates
- 133,794
- Election day
- November 6, 1990
- District map
- Older district map (1982 to 1990)
US House, New Jersey District 1, 1990, every candidate Candidate Party Votes and share Share DemocraticRobert E AndrewsWon Democratic 72,41554.1% RepublicanDaniel J Mangini Republican 57,29942.8% LibertarianJerry Zeldin Libertarian 1,5921.2% OtherWalter E Konstanty Other 1,4221.1% OtherWilliam Henry Harris Other 1,0660.8% - Votes for listed candidates
- 203,153
- Election day
- November 8, 1988
- District map
- Older district map (1982 to 1990)
US House, New Jersey District 1, 1988, every candidate Candidate Party Votes and share Share DemocraticJames J FlorioWon Democratic 141,98869.9% RepublicanFrank A Cristaudo Republican 60,03729.6% LibertarianRichard Bartucci Libertarian 1,1280.6% - Votes for listed candidates
- 123,601
- Election day
- November 4, 1986
- District map
- Older district map (1982 to 1990)
US House, New Jersey District 1, 1986, every candidate Candidate Party Votes and share Share DemocraticJames J FlorioWon Democratic 93,49775.6% RepublicanFred A Busch Republican 29,17323.6% LibertarianJerry Zeldin Libertarian 9310.8% - Votes for listed candidates
- 211,711
- Election day
- November 6, 1984
- District map
- Older district map (1982 to 1990)
US House, New Jersey District 1, 1984, every candidate Candidate Party Votes and share Share DemocraticJames J FlorioWon Democratic 152,12571.9% RepublicanFrederick A Busch Jr Republican 58,80027.8% LibertarianJerry Zeldin Libertarian 7860.4% - Votes for listed candidates
- 150,891
- Election day
- November 2, 1982
- District map
- Older district map (1982 to 1990)
US House, New Jersey District 1, 1982, every candidate Candidate Party Votes and share Share DemocraticJames J FlorioWon Democratic 110,57073.3% RepublicanJohn A Dramesi Republican 39,50126.2% LibertarianJerry Zeldin Libertarian 4930.3% OtherPatrick J McCann Other 3270.2% - Votes for listed candidates
- 192,081
- Election day
- November 4, 1980
- District map
- Older district map (1972 to 1980)
US House, New Jersey District 1, 1980, every candidate Candidate Party Votes and share Share DemocraticJames J FlorioWon Democratic 147,35276.7% RepublicanScott L Sibert Republican 42,15421.9% IndependentThomas S Watson Jr Independent 1,3270.7% LibertarianRonald K Wishart Libertarian 1,0290.5% OtherJulius Levin Other 2190.1% - Votes for listed candidates
- 133,620
- Election day
- November 7, 1978
- District map
- Older district map (1972 to 1980)
US House, New Jersey District 1, 1978, every candidate Candidate Party Votes and share Share DemocraticJames J FlorioWon Democratic 106,09679.4% RepublicanRobert Mark Deitch Republican 26,85320.1% OtherJulius Levin Other 6710.5% - Votes for listed candidates
- 194,898
- Election day
- November 2, 1976
- District map
- Older district map (1972 to 1980)
US House, New Jersey District 1, 1976, every candidate Candidate Party Votes and share Share DemocraticJames J FlorioWon Democratic 136,62470.1% RepublicanJoseph I McCullough Jr Republican 56,36328.9% LibertarianVernon A Smith Libertarian 8000.4% OtherThomas C Sloan Other 7840.4% OtherRobert Bowen Other 3270.2%
1976 to 2024: MIT Election Data and Science Lab, U.S. House 1976-2024, retrieved Oct 28, 2026. Compiled by MIT Election Data and Science Lab (MEDSL) from official returns; not an official source
District numbers are reused after each redistricting, so rows on older lines cover different territory than today's New Jersey District 1.
Download and cite
Cite this page
Election Wrld. (2026). New Jersey District 1, US House results. https://www.electionwrld.com/nj/congress/1. Retrieved October 31, 2026.
Embed this seat
<iframe src="https://www.electionwrld.com/embed/nj/congress/1" title="New Jersey District 1, US House" width="100%" height="400" style="border:0;max-width:640px" loading="lazy"></iframe>
<p style="font-size:13px">Data: <a href="https://www.electionwrld.com">Election Wrld</a>, CC BY 4.0</p>Sources
Sources: MIT Election Data and Science Lab, U.S. House 1976-2024 (CC0 1.0), retrieved Oct 28, 2026, compiled by MIT Election Data and Science Lab (MEDSL) from official returns, not an official source; Census TIGERweb Legislative MapServer (120th CDs layer 0, 119th CDs layer 4, 2026 SLD upper layer 1 and lower layer 2) (US Census Bureau, public domain), retrieved Oct 28, 2026; unitedstates/congress-legislators (current) (CC0-1.0), retrieved Oct 28, 2026, compiled by the @unitedstates project volunteers (rosters from official congressional sources) from official returns, not an official source.
DataState data (JSON)Sources: MIT Election Data and Science Lab, U.S. House 1976-2024, FEC, DIME (ODC-BY), Portraits: unitedstates/images (public domain)Data as of Oct 28, 2026