

New Jersey District 9
Tue, Nov 3 · Seat held by Nellie Pou Democratic since Jan 2025
No published poll names both candidates.Last result · 2024 general: Nellie Pou (D) 50.8, Billy Prempeh (R) 45.9, Benjamin Taylor (G) 2.0
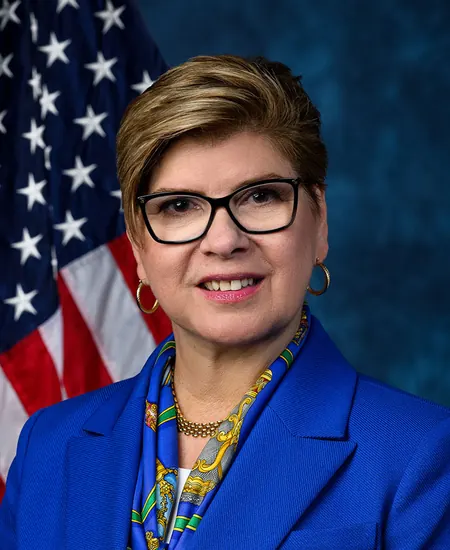
Show all 3 candidates on the ballot
- Nelida PouIncumbentDemocratic
- Rosie PinoRepublican
- Terrisa BukovinacIndependentSave Our Babies
Showing major-party nominees, incumbents and candidates with 5%+ in the latest poll or comparable fundraising.
- Last election
- Nellie Pou (Democratic) won by 4.9 points, 2024
- Margin since 2022
- 6.5 points toward Republicans
- On the 2026 ballot
- 3 candidates
Side by side
Left column: PinoRight column: Pou
- Total receipts, 2025-2026 cycle, through Oct 14
- $548K
- $3.1M
- Cash on hand
- $13K
- $1.1M
- Donor-based spectrum
- LiberalCentristConservativePouNo published score for Pino
Money: FEC bulk data, through Oct 14. One or more are matched to the FEC by name, party and seat, so a total could belong to someone else.
How these are counted
Total receipts line of each candidate’s principal campaign committee, 2025-2026 cycle. Other sites may show career, six-year or all-committee totals, which differ. Pino: $548,326 received, $13,133 cash on hand. Pou: $3,131,322 received, $1,080,500 cash on hand. The spectrum is a published research score, not our rating. How this works.
More about this race
Candidates on the ballot
- Nelida PouIncumbentDemocratic
- Rosie PinoRepublican
- Terrisa BukovinacIndependentSave Our Babies
Source: nj.gov (PDF), dated Sep 4
Shift since 2022: 6.5 points toward Republicans (Democratic by 11.4 in 2022, Democratic by 4.9 in 2024).
All New Jersey districts
- D 15+ pts
- D 5 to 15 pts
- D under 5 pts
- R under 5 pts
- R 5 to 15 pts
- R 15+ pts
- Other winner
- No data
Show these districts as a list (12)
- New Jersey District 1· Donald Norcross (D), Democratic by 17.8 points, 2024
- New Jersey District 2· Jefferson Van Drew (R), Republican by 16.9 points, 2024
- New Jersey District 3· Herbert C. Conaway, Jr. (D), Democratic by 8.5 points, 2024
- New Jersey District 4· Christopher H. Smith (R), Republican by 35.7 points, 2024
- New Jersey District 5· Josh Gottheimer (D), Democratic by 11.3 points, 2024
- New Jersey District 6· Frank Pallone, Jr. (D), Democratic by 15.8 points, 2024
- New Jersey District 7· Thomas H. Kean, Jr. (R), Republican by 5.4 points, 2024
- New Jersey District 8· Robert Menendez (D), Democratic by 24.6 points, 2024
- New Jersey District 9· Nellie Pou (D), Democratic by 4.9 points, 2024
- New Jersey District 10· LaMonica McIver (D), Democratic by 52.2 points, 2024
- New Jersey District 11· Mikie Sherrill (D), Democratic by 14.7 points, 2024
- New Jersey District 12· Bonnie Watson Coleman (D), Democratic by 24.8 points, 2024
Map settings
Vote in New Jersey
Trouble voting? Election Protection hotline: 866-OUR-VOTE. A nonpartisan coalition of civil-rights and voting-rights groups, not a government service. 866ourvote.org
Official results for New Jersey
History (25 elections for this seat)
- Votes for listed candidates
- 257,013
- Election day
- November 5, 2024
- District map
- Same as today
US House, New Jersey District 9, 2024, every candidate Candidate Party Votes and share Share DemocraticNellie PouWon Democratic 130,51450.8% RepublicanBilly Prempeh Republican 117,93945.9% GreenBenjamin Taylor Green 5,0272.0% LibertarianBruno Pereira Libertarian 3,5331.4% - Votes for listed candidates
- 149,984
- Election day
- November 8, 2022
- District map
- Same as today
US House, New Jersey District 9, 2022, every candidate Candidate Party Votes and share Share DemocraticBill Pascrell JrWon Democratic 82,45755.0% RepublicanBilly Prempeh Republican 65,36543.6% OtherLea Sherman Other 1,1080.7% LibertarianSean Armstrong Libertarian 1,0540.7% - Votes for listed candidates
- 309,542
- Election day
- November 3, 2020
- District map
- Older district map (2012 to 2020)
US House, New Jersey District 9, 2020, every candidate Candidate Party Votes and share Share DemocraticBill Pascrell JrWon Democratic 203,67465.8% RepublicanBilly Prempeh Republican 98,62931.9% OtherChris Auriemma Other 7,2392.3% - Votes for listed candidates
- 200,416
- Election day
- November 6, 2018
- District map
- Older district map (2012 to 2020)
US House, New Jersey District 9, 2018, every candidate Candidate Party Votes and share Share DemocraticBill Pascrell JrWon Democratic 140,83270.3% RepublicanEric P Fisher Republican 57,85428.9% LibertarianClaudio Belusic Libertarian 1,7300.9% - Votes for listed candidates
- 233,242
- Election day
- November 8, 2016
- District map
- Older district map (2012 to 2020)
US House, New Jersey District 9, 2016, every candidate Candidate Party Votes and share Share DemocraticBill Pascrell JrWon Democratic 162,64269.7% RepublicanHector L Castillo Republican 65,37628.0% LibertarianDiego Rivera Libertarian 3,3271.4% OtherJeff Boss Other 1,8970.8% - Votes for listed candidates
- 120,459
- Election day
- November 4, 2014
- District map
- Older district map (2012 to 2020)
US House, New Jersey District 9, 2014, every candidate Candidate Party Votes and share Share DemocraticBill PascrellWon Democratic 82,49868.5% RepublicanDierdre G Paul Republican 36,24630.1% OtherNestor Montilla Other 1,7151.4% - Votes for listed candidates
- 220,133
- Election day
- November 6, 2012
- District map
- Older district map (2012 to 2020)
US House, New Jersey District 9, 2012, every candidate Candidate Party Votes and share Share DemocraticBill Pascrell JrWon Democratic 162,82274.0% RepublicanShmuley Boteach Republican 55,09125.0% OtherE David Smith Other 1,1380.5% OtherJeanette Woolsey Other 1,0820.5% - Votes for listed candidates
- 137,626
- Election day
- November 2, 2010
- District map
- Older district map (2002 to 2010)
US House, New Jersey District 9, 2010, every candidate Candidate Party Votes and share Share DemocraticSteven R RothmanWon Democratic 83,56460.7% RepublicanMichael A Agosta Republican 52,08237.8% GreenPatricia Alessandrini Green 1,9801.4% - Votes for listed candidates
- 223,885
- Election day
- November 4, 2008
- District map
- Older district map (2002 to 2010)
US House, New Jersey District 9, 2008, every candidate Candidate Party Votes and share Share DemocraticSteven R RothmanWon Democratic 151,18267.5% RepublicanVincent Micco Republican 69,50331.0% IndependentMichael Perrone Jr Independent 3,2001.4% - Votes for listed candidates
- 148,095
- Election day
- November 7, 2006
- District map
- Older district map (2002 to 2010)
US House, New Jersey District 9, 2006, every candidate Candidate Party Votes and share Share DemocraticSteven R RothmanWon Democratic 105,85371.5% RepublicanVincent Micco Republican 40,87927.6% OtherMichael Jarvis Other 1,3630.9% - Votes for listed candidates
- 216,251
- Election day
- November 2, 2004
- District map
- Older district map (2002 to 2010)
US House, New Jersey District 9, 2004, every candidate Candidate Party Votes and share Share DemocraticSteven R RothmanWon Democratic 146,03867.5% RepublicanEdward Trawinski Republican 68,56431.7% IndependentDavid Daly Independent 1,6490.8% - Votes for listed candidates
- 139,196
- Election day
- November 5, 2002
- District map
- Older district map (2002 to 2010)
US House, New Jersey District 9, 2002, every candidate Candidate Party Votes and share Share DemocraticSteven R RothmanWon Democratic 97,10869.8% RepublicanJoseph Glass Republican 42,08830.2% - Votes for listed candidates
- 206,771
- Election day
- November 7, 2000
- District map
- Older district map (1992 to 2000)
US House, New Jersey District 9, 2000, every candidate Candidate Party Votes and share Share DemocraticSteven R RothmanWon Democratic 140,46267.9% RepublicanJoseph Tedeschi Republican 61,98430.0% IndependentLewis Pell Independent 2,2731.1% IndependentMichael Perrone Jr Independent 1,0720.5% IndependentRobert Corriston Independent 9800.5% - Votes for listed candidates
- 141,459
- Election day
- November 3, 1998
- District map
- Older district map (1992 to 2000)
US House, New Jersey District 9, 1998, every candidate Candidate Party Votes and share Share DemocraticSteven R RothmanWon Democratic 91,33064.6% RepublicanSteve Lonegan Republican 47,81733.8% IndependentMichael Perrone Jr Independent 1,3491.0% IndependentMichael W Koontz Independent 6860.5% IndependentKenneth Ebel Independent 2770.2% - Votes for listed candidates
- 210,930
- Election day
- November 5, 1996
- District map
- Older district map (1992 to 2000)
US House, New Jersey District 9, 1996, every candidate Candidate Party Votes and share Share DemocraticSteven R RothmanWon Democratic 117,64655.8% RepublicanKathleen A Donovan Republican 89,00542.2% IndependentArthur B Rosen Independent 2,7301.3% IndependentLeon Myerson Independent 1,5490.7% - Votes for listed candidates
- 159,888
- Election day
- November 8, 1994
- District map
- Older district map (1992 to 2000)
US House, New Jersey District 9, 1994, every candidate Candidate Party Votes and share Share DemocraticRobert G TorricelliWon Democratic 99,98462.5% RepublicanPeter J Russo Republican 57,65136.1% IndependentGregory Pason Independent 1,4900.9% OtherKenneth Ebel Other 7630.5% - Votes for listed candidates
- 238,704
- Election day
- November 3, 1992
- District map
- Older district map (1992 to 2000)
US House, New Jersey District 9, 1992, every candidate Candidate Party Votes and share Share DemocraticRobert G TorricelliWon Democratic 139,18858.3% RepublicanPatrick J Roma Republican 88,17936.9% OtherPeter J Russo Other 4,4911.9% OtherGary Novosielski Other 2,2570.9% OtherJoseph D'Alessio Other 1,6060.7% OtherHerbert H Shaw Other 1,3690.6% LibertarianDaniel M Karlan Libertarian 1,0990.5% OtherShel Haas Other 5150.2% - Votes for listed candidates
- 154,766
- Election day
- November 6, 1990
- District map
- Older district map (1982 to 1990)
US House, New Jersey District 9, 1990, every candidate Candidate Party Votes and share Share DemocraticRobert G TorricelliWon Democratic 82,53553.3% RepublicanPeter J Russo Republican 69,65845.0% OtherChester Grabowski Other 2,5731.7% - Votes for listed candidates
- 211,494
- Election day
- November 8, 1988
- District map
- Older district map (1982 to 1990)
US House, New Jersey District 9, 1988, every candidate Candidate Party Votes and share Share DemocraticRobert G TorricelliWon Democratic 142,01267.1% RepublicanRoger J Lane Republican 68,36332.3% OtherRichard J Kemly Other 1,1190.5% - Votes for listed candidates
- 129,860
- Election day
- November 4, 1986
- District map
- Older district map (1982 to 1990)
US House, New Jersey District 9, 1986, every candidate Candidate Party Votes and share Share DemocraticRobert G TorricelliWon Democratic 89,63469.0% RepublicanArthur F Jones Republican 40,22631.0% - Votes for listed candidates
- 238,659
- Election day
- November 6, 1984
- District map
- Older district map (1982 to 1990)
US House, New Jersey District 9, 1984, every candidate Candidate Party Votes and share Share DemocraticRobert G TorricelliWon Democratic 149,49362.6% RepublicanNeil Romano Republican 89,16637.4% - Votes for listed candidates
- 186,879
- Election day
- November 2, 1982
- District map
- Older district map (1982 to 1990)
US House, New Jersey District 9, 1982, every candidate Candidate Party Votes and share Share DemocraticRobert G TorricelliWon Democratic 99,09053.0% RepublicanHarold C "Cap" Hollenbeck Republican 86,02246.0% LibertarianRobert Shapiro Libertarian 1,7670.9% - Votes for listed candidates
- 196,504
- Election day
- November 4, 1980
- District map
- Older district map (1972 to 1980)
US House, New Jersey District 9, 1980, every candidate Candidate Party Votes and share Share RepublicanHarold C HollenbeckWon Republican 116,12859.1% DemocraticGarbiel M Ambrosio Democratic 75,32138.3% LibertarianHenry Koch Libertarian 2,2901.2% OtherHerbert H Shaw Other 1,5880.8% OtherEdward G Davis Other 1,1770.6% - Votes for listed candidates
- 150,155
- Election day
- November 7, 1978
- District map
- Older district map (1972 to 1980)
US House, New Jersey District 9, 1978, every candidate Candidate Party Votes and share Share RepublicanHarold C HollenbeckWon Republican 73,47848.9% DemocraticNicholas S Mastorelli Democratic 56,88837.9% IndependentHenry Helstoski Independent 19,12612.7% OtherBruce Todd Other 6630.4% - Votes for listed candidates
- 202,344
- Election day
- November 2, 1976
- District map
- Older district map (1972 to 1980)
US House, New Jersey District 9, 1976, every candidate Candidate Party Votes and share Share RepublicanHarold C HollenbeckWon Republican 107,45453.1% DemocraticHenry Helstoski Democratic 89,72344.3% OtherHerbert H Shaw Other 1,8140.9% LibertarianFrank J Primich Libertarian 1,7590.9% OtherJames J Terlizzi Sr Other 1,5940.8%
1976 to 2024: MIT Election Data and Science Lab, U.S. House 1976-2024, retrieved Oct 28, 2026. Compiled by MIT Election Data and Science Lab (MEDSL) from official returns; not an official source
District numbers are reused after each redistricting, so rows on older lines cover different territory than today's New Jersey District 9.
Download and cite
Cite this page
Election Wrld. (2026). New Jersey District 9, US House results. https://www.electionwrld.com/nj/congress/9. Retrieved October 30, 2026.
Embed this seat
<iframe src="https://www.electionwrld.com/embed/nj/congress/9" title="New Jersey District 9, US House" width="100%" height="400" style="border:0;max-width:640px" loading="lazy"></iframe>
<p style="font-size:13px">Data: <a href="https://www.electionwrld.com">Election Wrld</a>, CC BY 4.0</p>Sources
Sources: MIT Election Data and Science Lab, U.S. House 1976-2024 (CC0 1.0), retrieved Oct 28, 2026, compiled by MIT Election Data and Science Lab (MEDSL) from official returns, not an official source; Census TIGERweb Legislative MapServer (120th CDs layer 0, 119th CDs layer 4, 2026 SLD upper layer 1 and lower layer 2) (US Census Bureau, public domain), retrieved Oct 28, 2026; unitedstates/congress-legislators (current) (CC0-1.0), retrieved Oct 28, 2026, compiled by the @unitedstates project volunteers (rosters from official congressional sources) from official returns, not an official source.
DataState data (JSON)Sources: MIT Election Data and Science Lab, U.S. House 1976-2024, FEC, DIME (ODC-BY), Photo creditsData as of Oct 28, 2026