

New Jersey District 2
Tue, Nov 3 · Seat held by Jefferson Van Drew Republican since Jan 2019
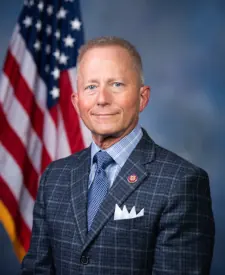
Jefferson Van Drew 50Zack Mullock 40
Only 1 poll in the last 7 weeksNewest poll · Impact Research, field dates Oct 7 to Oct 10, released Oct 23, partisan (D), per VoteHubPoll sponsored by House Majority PACPolls fetched Oct 30, 2:02 a.m. ET, from VoteHub
Show all 3 candidates on the ballot
- Zack MullockDemocratic
- Jefferson Van DrewIncumbentRepublican
- Ramon Mora Jr.Independent
Showing major-party nominees, incumbents and candidates with 5%+ in the latest poll or comparable fundraising.
- Last election
- Jefferson Van Drew (Republican) won by 16.9 points, 2024
- Margin since 2022
- 2.0 points toward Democrats
- On the 2026 ballot
- 3 candidates
Polls over time
One published poll names these candidates: Impact Research, Oct 7 to Oct 10, released Oct 23. All 1 on the polls page. Polls fetched Oct 30, 2:02 a.m. ET, from VoteHub.
Side by side
Drew left, Mullock right- Total receipts, 2025-2026 cycle, through Oct 14
- $2.4M
- $961K
- Cash on hand
- $895K
- $105K
- Donor-based spectrum
- LiberalCentristConservativeDrewNo published score for Mullock
- Record
- 11-0
- None on file
- Years in politics
- 7
- Not available
- Age on Election Day
- 73
- Not available
Jefferson Van Drew on fec.gov. Zack Mullock on fec.gov. One or more are matched to the FEC by name, party and seat, so a total could belong to someone else.
How these are counted
Total receipts line of each candidate’s principal campaign committee, 2025-2026 cycle. Other sites may show career, six-year or all-committee totals, which differ. The spectrum is a published research score, not our rating. How this works. Record is wins and losses in the races in our results files, the same count as each profile.
What changed in this race
Newest firstNEW POLLNew Jersey District 2
New Jersey District 2: Jeff Van Drew 50, Zach Mullock 40
Impact Research, Oct 7 to Oct 10, likely voters · via VoteHub (CC BY 4.0)
More about this race
Candidates on the ballot
- Zack MullockDemocratic
- Jefferson Van DrewIncumbentRepublican
- Ramon Mora Jr.Independent
Source: nj.gov (PDF), dated Sep 4
Shift since 2022: 2.0 points toward Democrats (Republican by 18.9 in 2022, Republican by 16.9 in 2024).
All New Jersey districts
- D 15+ pts
- D 5 to 15 pts
- D under 5 pts
- R under 5 pts
- R 5 to 15 pts
- R 15+ pts
- Other winner
- No data
Show these districts as a list (12)
- New Jersey District 1· Donald Norcross (D), Democratic by 17.8 points, 2024
- New Jersey District 2· Jefferson Van Drew (R), Republican by 16.9 points, 2024
- New Jersey District 3· Herbert C. Conaway, Jr. (D), Democratic by 8.5 points, 2024
- New Jersey District 4· Christopher H. Smith (R), Republican by 35.7 points, 2024
- New Jersey District 5· Josh Gottheimer (D), Democratic by 11.3 points, 2024
- New Jersey District 6· Frank Pallone, Jr. (D), Democratic by 15.8 points, 2024
- New Jersey District 7· Thomas H. Kean, Jr. (R), Republican by 5.4 points, 2024
- New Jersey District 8· Robert Menendez (D), Democratic by 24.6 points, 2024
- New Jersey District 9· Nellie Pou (D), Democratic by 4.9 points, 2024
- New Jersey District 10· LaMonica McIver (D), Democratic by 52.2 points, 2024
- New Jersey District 11· Mikie Sherrill (D), Democratic by 14.7 points, 2024
- New Jersey District 12· Bonnie Watson Coleman (D), Democratic by 24.8 points, 2024
Map settings
Vote in New Jersey
Trouble voting? Election Protection hotline: 866-OUR-VOTE. A nonpartisan coalition of civil-rights and voting-rights groups, not a government service. 866ourvote.org
Official results for New Jersey
History (25 elections for this seat)
- Votes for listed candidates
- 371,620
- Election day
- November 5, 2024
- District map
- Same as today
US House, New Jersey District 2, 2024, every candidate Candidate Party Votes and share Share RepublicanJefferson Van DrewWon Republican 215,94658.1% DemocraticJoseph F. Salerno Democratic 153,11741.2% GreenThomas Cannavo Green 2,5570.7% - Votes for listed candidates
- 236,484
- Election day
- November 8, 2022
- District map
- Same as today
US House, New Jersey District 2, 2022, every candidate Candidate Party Votes and share Share RepublicanJefferson Van DrewWon Republican 139,21758.9% DemocraticTim Alexander Democratic 94,52240.0% LibertarianMichael Gallo Libertarian 1,8250.8% OtherAnthony Parisi Sanchez Other 9200.4% - Votes for listed candidates
- 376,547
- Election day
- November 3, 2020
- District map
- Older district map (2012 to 2020)
US House, New Jersey District 2, 2020, every candidate Candidate Party Votes and share Share RepublicanJefferson Van DrewWon Republican 195,52651.9% DemocraticAmy Kennedy Democratic 173,84946.2% OtherJenna Harvey Other 4,1361.1% LibertarianJesse Ehrnstrom Libertarian 3,0360.8% - Votes for listed candidates
- 258,363
- Election day
- November 6, 2018
- District map
- Older district map (2012 to 2020)
US House, New Jersey District 2, 2018, every candidate Candidate Party Votes and share Share DemocraticJefferson Van DrewWonName as filed: Jeff Van Drew Democratic 136,68552.9% RepublicanSeth Grossman Republican 116,86645.2% LibertarianJohn Ordille Libertarian 1,7260.7% OtherSteven Fenichel Other 1,1540.4% OtherAnthony Parisi Sanchez Other 1,0640.4% OtherWilliam R Benfer Other 8680.3% - Votes for listed candidates
- 297,795
- Election day
- November 8, 2016
- District map
- Older district map (2012 to 2020)
US House, New Jersey District 2, 2016, every candidate Candidate Party Votes and share Share RepublicanFrank A LobiondoWon Republican 176,33859.2% DemocraticDavid H Cole Democratic 110,83837.2% LibertarianJohn Ordille Libertarian 3,7731.3% OtherJames Keenan Other 2,6530.9% OtherSteven Fenichel Other 1,5740.5% OtherEric Beechwood Other 1,3870.5% OtherGabriel Brian Franco Other 1,2320.4% - Votes for listed candidates
- 177,148
- Election day
- November 4, 2014
- District map
- Older district map (2012 to 2020)
US House, New Jersey District 2, 2014, every candidate Candidate Party Votes and share Share RepublicanFrank A LobiondoWon Republican 108,87561.5% DemocraticWilliam J Hughes Jr Democratic 66,02637.3% OtherAlexander H Spano Other 6630.4% IndependentGary Stein Independent 6120.3% OtherCostantino Rozzo Other 5010.3% IndependentBayode Olabisi Independent 4710.3% - Votes for listed candidates
- 289,069
- Election day
- November 6, 2012
- District map
- Older district map (2012 to 2020)
US House, New Jersey District 2, 2012, every candidate Candidate Party Votes and share Share RepublicanFrank A LobiondoWon Republican 166,67757.7% DemocraticCassandra Shober Democratic 116,46240.3% LibertarianJohn Ordille Libertarian 2,6990.9% OtherCharles Lukens Other 1,3290.5% OtherDavid W Bowen Sr Other 1,0100.3% OtherFrank Faralli Jr Other 8920.3% - Votes for listed candidates
- 167,120
- Election day
- November 2, 2010
- District map
- Older district map (2002 to 2010)
US House, New Jersey District 2, 2010, every candidate Candidate Party Votes and share Share RepublicanFrank A LobiondoWon Republican 109,46065.5% DemocraticGary Stein Democratic 51,69030.9% OtherPeter F Boyce Other 4,1202.5% OtherMark Lovett Other 1,1230.7% OtherVitov Valdes-Munoz Other 7270.4% - Votes for listed candidates
- 283,965
- Election day
- November 4, 2008
- District map
- Older district map (2002 to 2010)
US House, New Jersey District 2, 2008, every candidate Candidate Party Votes and share Share RepublicanFrank A LobiondoWon Republican 167,70159.1% DemocraticDavid Kurkowski Democratic 110,99039.1% GreenJason M Grover Green 1,7630.6% OtherPeter F Boyce Other 1,5510.5% OtherGary Stein Other 1,3120.5% OtherCostantino Rozzo Other 6480.2% - Votes for listed candidates
- 180,573
- Election day
- November 7, 2006
- District map
- Older district map (2002 to 2010)
US House, New Jersey District 2, 2006, every candidate Candidate Party Votes and share Share RepublicanFrank A LobiondoWon Republican 111,24561.6% DemocraticViola Thomas-Hughes Democratic 64,27735.6% OtherRobert E Mullock Other 3,0711.7% OtherLynn Merle Other 9920.5% OtherThomas Fanslau Other 6030.3% OtherWillie Norwood Other 3850.2% - Votes for listed candidates
- 265,442
- Election day
- November 2, 2004
- District map
- Older district map (2002 to 2010)
US House, New Jersey District 2, 2004, every candidate Candidate Party Votes and share Share RepublicanFrank A LobiondoWon Republican 172,77965.1% DemocraticTimothy J Robb Democratic 86,79232.7% IndependentWillie Norwood Independent 1,9930.8% IndependentMichael J Matthews Jr Independent 1,7670.7% IndependentJose David Alcantara Independent 1,5160.6% IndependentCostantino Rozzo Independent 5950.2% - Votes for listed candidates
- 168,799
- Election day
- November 5, 2002
- District map
- Older district map (2002 to 2010)
US House, New Jersey District 2, 2002, every candidate Candidate Party Votes and share Share RepublicanFrank A LobiondoWon Republican 116,83469.2% DemocraticSteven A Farkas Democratic 47,73528.3% GreenRoger Merle Green 1,7391.0% LibertarianMichael J Matthews Jr Libertarian 1,7201.0% OtherCostantino Rozzo Other 7710.5% - Votes for listed candidates
- 233,859
- Election day
- November 7, 2000
- District map
- Older district map (1992 to 2000)
US House, New Jersey District 2, 2000, every candidate Candidate Party Votes and share Share RepublicanFrank A LobiondoWon Republican 155,18766.4% DemocraticEdward G Janosik Democratic 74,63231.9% IndependentRobert Gabrielsky Independent 3,2521.4% IndependentConstantino Rozzo Independent 7880.3% - Votes for listed candidates
- 141,514
- Election day
- November 3, 1998
- District map
- Older district map (1992 to 2000)
US House, New Jersey District 2, 1998, every candidate Candidate Party Votes and share Share RepublicanFrank A LobiondoWon Republican 93,24865.9% DemocraticDerek Hunsberger Democratic 43,56330.8% IndependentGlenn Campbell Independent 2,9552.1% IndependentMary A Whittam Independent 1,7481.2% - Votes for listed candidates
- 220,718
- Election day
- November 5, 1996
- District map
- Older district map (1992 to 2000)
US House, New Jersey District 2, 1996, every candidate Candidate Party Votes and share Share RepublicanFrank A LobiondoWon Republican 133,13160.3% DemocraticRuth Katz Democratic 83,89038.0% IndependentDavid Rodger Headrick Independent 1,4390.7% IndependentJudith Lee Azaren Independent 1,1740.5% IndependentAndrea Lippi Independent 1,0840.5% - Votes for listed candidates
- 158,717
- Election day
- November 8, 1994
- District map
- Older district map (1992 to 2000)
US House, New Jersey District 2, 1994, every candidate Candidate Party Votes and share Share RepublicanFrank A LobiondoWon Republican 102,56664.6% DemocraticLouis N Magazzu Democratic 56,15135.4% - Votes for listed candidates
- 237,027
- Election day
- November 3, 1992
- District map
- Older district map (1992 to 2000)
US House, New Jersey District 2, 1992, every candidate Candidate Party Votes and share Share DemocraticWilliam J HughesWon Democratic 132,46555.9% RepublicanFrank A Lobiondo Republican 98,31541.5% LibertarianRoger W Bacon Libertarian 2,5751.1% OtherJoseph Ponczek Other 2,0670.9% OtherAndrea Lippi Other 1,6050.7% - Votes for listed candidates
- 110,818
- Election day
- November 6, 1990
- District map
- Older district map (1982 to 1990)
US House, New Jersey District 2, 1990, every candidate Candidate Party Votes and share Share DemocraticWilliam J HughesWon Democratic 97,69888.2% OtherWilliam A Kanengiser Other 13,12011.8% - Votes for listed candidates
- 204,636
- Election day
- November 8, 1988
- District map
- Older district map (1982 to 1990)
US House, New Jersey District 2, 1988, every candidate Candidate Party Votes and share Share DemocraticWilliam J HughesWon Democratic 134,50565.7% RepublicanKirk W Conover Republican 67,75933.1% OtherRichard A Schindewolf Jr Other 2,3721.2% - Votes for listed candidates
- 122,800
- Election day
- November 4, 1986
- District map
- Older district map (1982 to 1990)
US House, New Jersey District 2, 1986, every candidate Candidate Party Votes and share Share DemocraticWilliam J HughesWon Democratic 83,82168.3% RepublicanAlfred J Bennington Jr Republican 35,16728.6% OtherLen Smith Other 3,8123.1% - Votes for listed candidates
- 210,072
- Election day
- November 6, 1984
- District map
- Older district map (1982 to 1990)
US House, New Jersey District 2, 1984, every candidate Candidate Party Votes and share Share DemocraticWilliam J HughesWon Democratic 132,84163.2% RepublicanRaymond G Massie Republican 77,23136.8% - Votes for listed candidates
- 151,128
- Election day
- November 2, 1982
- District map
- Older district map (1982 to 1990)
US House, New Jersey District 2, 1982, every candidate Candidate Party Votes and share Share DemocraticWilliam J HughesWon Democratic 102,82668.0% RepublicanJohn J Mahoney Republican 47,06931.1% LibertarianBruce Powers Libertarian 1,2330.8% - Votes for listed candidates
- 235,710
- Election day
- November 4, 1980
- District map
- Older district map (1972 to 1980)
US House, New Jersey District 2, 1980, every candidate Candidate Party Votes and share Share DemocraticWilliam J HughesWon Democratic 135,43757.5% RepublicanBeech N Fox Republican 97,07241.2% LibertarianRobert C Rothhouse Libertarian 2,2621.0% OtherAdele Frisch Other 9390.4% - Votes for listed candidates
- 169,765
- Election day
- November 7, 1978
- District map
- Older district map (1972 to 1980)
US House, New Jersey District 2, 1978, every candidate Candidate Party Votes and share Share DemocraticWilliam J HughesWon Democratic 112,76866.4% RepublicanJames H Biggs Republican 56,99733.6% - Votes for listed candidates
- 229,668
- Election day
- November 2, 1976
- District map
- Older district map (1972 to 1980)
US House, New Jersey District 2, 1976, every candidate Candidate Party Votes and share Share DemocraticWilliam J HughesWon Democratic 141,75361.7% RepublicanJames R Hurley Republican 87,91538.3%
All rows: MIT Election Data and Science Lab, U.S. House 1976-2024, retrieved Oct 28, 2026
District numbers are reused after each redistricting, so rows on older lines cover different territory than today's New Jersey District 2.
Download and cite
Cite this page
Election Wrld. (2026). New Jersey District 2, US House results. https://www.electionwrld.com/nj/congress/2. Retrieved October 30, 2026.
Embed this seat
<iframe src="https://www.electionwrld.com/embed/nj/congress/2" title="New Jersey District 2, US House" width="100%" height="400" style="border:0;max-width:640px" loading="lazy"></iframe>
<p style="font-size:13px">Data: <a href="https://www.electionwrld.com">Election Wrld</a>, CC BY 4.0</p>Sources
Sources
- Used for
- web/data/results/house/{ST}.json. The Dataverse API refuses this file behind a guestbook, so the identical file was taken from two public GitHub copies (Hackquantumcpp/snoutcounter-midterms-2026-model data/1976-2024-house.csv and sta199-f26/sta199-f26.github.io _data/gerrymander/1976-2024-house.tab), which are byte-identical to each other and match the md5 a9566ac393913a1af343284e837c17bb that Dataverse lists for dataset version 15.0 (2026-03-09). sha256 76eec42483ee9f0fc5cf6e377442c783d1ae6eefa929729fd6561a69bab47f2a.
- License
- CC0 1.0
- Retrieved
- October 28, 2026
- Link
- https://doi.org/10.7910/DVN/IG0UN2
- Used for
- cd.topo.json, sld/*.topo.json
- License
- US Census Bureau, public domain
- Retrieved
- October 28, 2026
- Link
- https://tigerweb.geo.census.gov/arcgis/rest/services/TIGERweb/Legislative/MapServer
- Used for
- web/data/officials/congress.json (name, party, bioguide, official site, service start) and web/data/people (birth year, committees, social media handles and profile links; links only, nothing copied from the platforms). As-of: the files saved in data/raw/people on 2026-10-29.
- License
- CC0-1.0
- Retrieved
- October 28, 2026
- Link
- https://unitedstates.github.io/congress-legislators/legislators-current.json
DataState data (JSON)Sources: MIT Election Data and Science Lab, U.S. House 1976-2024, VoteHub polls (CC BY 4.0), FEC, DIME (ODC-BY), Portraits: unitedstates/images (public domain)Data as of Oct 28, 2026