

New Jersey District 7
Tue, Nov 3 · Seat held by Thomas H. Kean, Jr. Republican since Jan 2023
Bennett 47 · Kean 43No polls in the last 7 weeksNewest poll · Z to A Research, field dates May 24 to May 26, released Jun 11, 430 likely voters, partisan (D), per VoteHubPoll sponsored by 314 ActionPolls updated Oct 31, 9:30 a.m. ET, from VoteHub
Show all 3 candidates on the ballot
- Rebecca BennettDemocratic
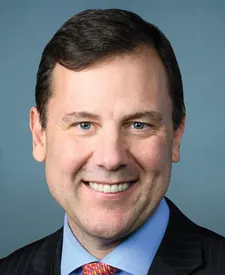
- Thomas H. Kean, Jr.IncumbentRepublican
- Seamus Patrick O'TooleIndependentStop Israel's Genocide
Showing major-party nominees, incumbents and candidates with 5%+ in the latest poll or comparable fundraising.
- Last election
- Thomas H. Kean, Jr. (Republican) won by 5.4 points, 2024
- Margin since 2022
- 2.6 points toward Republicans
- On the 2026 ballot
- 3 candidates
Polls over time
One published poll names these candidates: Z to A Research, May 24 to May 26, released Jun 11. All 1 on the polls page. Polls updated Oct 31, 9:30 a.m. ET, from VoteHub.
Side by side
Left column: BennettRight column: Kean
- Total receipts, 2025-2026 cycle, through Oct 14
- $8.8M
- $6.1M
- Cash on hand
- $1.1M
- $1.4M
- Donor-based spectrum
- LiberalCentristConservativeKeanNo published score for Bennett
- Races
- None listed
- Won 8 of 11
- Years since first win
- Not available
- 3
- Age on Election Day
- Not available
- 58
Where the money came from
- Individuals
- $7.7M
- $2.8M
- PACs and other committees
- $521K
- $1.5M
- Party committees
- $5K
- $10K
- Candidate’s own money
- $327
- $0
- Loans from the candidate
- $0
- $0
As each campaign reported to the FEC. Some money has no line here, so these may not add up to the total. Committees giving to Rebecca Bennett. Committees giving to Thomas H. Kean, Jr..
Money: FEC bulk data, through Oct 14. One or more are matched to the FEC by name, party and seat, so a total could belong to someone else.
How these are counted
Total receipts line of each candidate’s principal campaign committee, 2025-2026 cycle. Other sites may show career, six-year or all-committee totals, which differ. Bennett: $8,757,003 received, $1,053,454 cash on hand. Kean: $6,128,373 received, $1,365,406 cash on hand. The spectrum is a published research score, not our rating. How this works. Wins and losses count the races in our results files, the same as each profile.
More about this race
Candidates on the ballot
- Rebecca BennettDemocratic
- Thomas H. Kean, Jr.IncumbentRepublican
- Seamus Patrick O'TooleIndependentStop Israel's Genocide
Source: nj.gov (PDF), dated Sep 4
Shift since 2022: 2.6 points toward Republicans (Republican by 2.8 in 2022, Republican by 5.4 in 2024).
All New Jersey districts
- D 15+ pts
- D 5 to 15 pts
- D under 5 pts
- R under 5 pts
- R 5 to 15 pts
- R 15+ pts
- Other winner
- No data
Show these districts as a list (12)
- New Jersey District 1· Donald Norcross (D), Democratic by 17.8 points, 2024
- New Jersey District 2· Jefferson Van Drew (R), Republican by 16.9 points, 2024
- New Jersey District 3· Herbert C. Conaway, Jr. (D), Democratic by 8.5 points, 2024
- New Jersey District 4· Christopher H. Smith (R), Republican by 35.7 points, 2024
- New Jersey District 5· Josh Gottheimer (D), Democratic by 11.3 points, 2024
- New Jersey District 6· Frank Pallone, Jr. (D), Democratic by 15.8 points, 2024
- New Jersey District 7· Thomas H. Kean, Jr. (R), Republican by 5.4 points, 2024
- New Jersey District 8· Robert Menendez (D), Democratic by 24.6 points, 2024
- New Jersey District 9· Nellie Pou (D), Democratic by 4.9 points, 2024
- New Jersey District 10· LaMonica McIver (D), Democratic by 52.2 points, 2024
- New Jersey District 11· Mikie Sherrill (D), Democratic by 14.7 points, 2024
- New Jersey District 12· Bonnie Watson Coleman (D), Democratic by 24.8 points, 2024
Map settings
Vote in New Jersey
Trouble voting? Election Protection hotline: 866-OUR-VOTE. A nonpartisan coalition of civil-rights and voting-rights groups, not a government service. 866ourvote.org
Official results for New Jersey
History (25 elections for this seat)
- Votes for listed candidates
- 431,398
- Election day
- November 5, 2024
- District map
- Same as today
US House, New Jersey District 7, 2024, every candidate Candidate Party Votes and share Share RepublicanThomas H. Kean, Jr.Won Republican 223,33151.8% DemocraticSue Altman Democratic 200,02546.4% GreenAndrew Black Green 4,2581.0% LibertarianLana Leguia Libertarian 3,7840.9% - Votes for listed candidates
- 310,093
- Election day
- November 8, 2022
- District map
- Same as today
US House, New Jersey District 7, 2022, every candidate Candidate Party Votes and share Share RepublicanThomas H. Kean, Jr.Won Republican 159,39251.4% DemocraticTom Malinowski Democratic 150,70148.6% - Votes for listed candidates
- 433,947
- Election day
- November 3, 2020
- District map
- Older district map (2012 to 2020)
US House, New Jersey District 7, 2020, every candidate Candidate Party Votes and share Share DemocraticTom MalinowskiWon Democratic 219,62950.6% RepublicanThomas H. Kean, Jr. Republican 214,31849.4% - Votes for listed candidates
- 322,742
- Election day
- November 6, 2018
- District map
- Older district map (2012 to 2020)
US House, New Jersey District 7, 2018, every candidate Candidate Party Votes and share Share DemocraticTom MalinowskiWon Democratic 166,98551.7% RepublicanLeonard Lance Republican 150,78546.7% GreenDiane Moxley Green 2,6760.8% OtherGregg Mele Other 2,2960.7% - Votes for listed candidates
- 343,635
- Election day
- November 8, 2016
- District map
- Older district map (2012 to 2020)
US House, New Jersey District 7, 2016, every candidate Candidate Party Votes and share Share RepublicanLeonard LanceWon Republican 185,85054.1% DemocraticPeter Jacob Democratic 148,18843.1% LibertarianDan O'Neill Libertarian 5,3431.6% OtherArthur T Haussmann Jr Other 4,2541.2% - Votes for listed candidates
- 175,997
- Election day
- November 4, 2014
- District map
- Older district map (2012 to 2020)
US House, New Jersey District 7, 2014, every candidate Candidate Party Votes and share Share RepublicanLeonard LanceWon Republican 104,28759.3% DemocraticJanice Kovach Democratic 68,23238.8% LibertarianJames Gawron Libertarian 3,4782.0% - Votes for listed candidates
- 307,315
- Election day
- November 6, 2012
- District map
- Older district map (2012 to 2020)
US House, New Jersey District 7, 2012, every candidate Candidate Party Votes and share Share RepublicanLeonard LanceWon Republican 175,66257.2% DemocraticUpendra J Chivukula Democratic 123,05740.0% OtherDennis A Breen Other 4,5181.5% LibertarianPatrick McKnight Libertarian 4,0781.3% - Votes for listed candidates
- 176,986
- Election day
- November 2, 2010
- District map
- Older district map (2002 to 2010)
US House, New Jersey District 7, 2010, every candidate Candidate Party Votes and share Share RepublicanLeonard LanceWon Republican 105,08459.4% DemocraticEd Potosnak Democratic 71,90240.6% - Votes for listed candidates
- 295,628
- Election day
- November 4, 2008
- District map
- Older district map (2002 to 2010)
US House, New Jersey District 7, 2008, every candidate Candidate Party Votes and share Share RepublicanLeonard LanceWon Republican 148,46150.2% DemocraticLinda Stender Democratic 124,81842.2% OtherMichael P Hsing Other 16,4195.6% OtherDean Greco Other 3,2591.1% OtherThomas D Abrams Other 2,6710.9% - Votes for listed candidates
- 199,075
- Election day
- November 7, 2006
- District map
- Older district map (2002 to 2010)
US House, New Jersey District 7, 2006, every candidate Candidate Party Votes and share Share RepublicanMike FergusonWon Republican 98,39949.4% DemocraticLinda Stender Democratic 95,45447.9% OtherThomas D Abrams Other 3,1761.6% LibertarianDarren Young Libertarian 2,0461.0% - Votes for listed candidates
- 285,847
- Election day
- November 2, 2004
- District map
- Older district map (2002 to 2010)
US House, New Jersey District 7, 2004, every candidate Candidate Party Votes and share Share RepublicanMike FergusonWon Republican 162,59756.9% DemocraticSteve Brozak Democratic 119,08141.7% IndependentThomas D Abrams Independent 2,1530.8% IndependentMatthew Angus Williams Independent 2,0160.7% - Votes for listed candidates
- 183,002
- Election day
- November 5, 2002
- District map
- Older district map (2002 to 2010)
US House, New Jersey District 7, 2002, every candidate Candidate Party Votes and share Share RepublicanMike FergusonWon Republican 106,05558.0% DemocraticTim Carden Democratic 74,87940.9% LibertarianDarren Young Libertarian 2,0681.1% - Votes for listed candidates
- 248,999
- Election day
- November 7, 2000
- District map
- Older district map (1992 to 2000)
US House, New Jersey District 7, 2000, every candidate Candidate Party Votes and share Share RepublicanMike FergusonWon Republican 128,43451.6% DemocraticMaryanne Connelly Democratic 113,47945.6% IndependentJerry L Coleman Independent 5,4442.2% IndependentDarren Young Independent 9730.4% IndependentShawn Gianella Independent 3860.2% IndependentMary T Johnson Independent 2830.1% - Votes for listed candidates
- 148,042
- Election day
- November 3, 1998
- District map
- Older district map (1992 to 2000)
US House, New Jersey District 7, 1998, every candidate Candidate Party Votes and share Share RepublicanBob FranksWon Republican 77,75152.5% DemocraticMaryanne S Connelly Democratic 65,77644.4% IndependentRichard C Martin Independent 3,0072.0% IndependentDarren Young Independent 1,5081.0% - Votes for listed candidates
- 232,571
- Election day
- November 5, 1996
- District map
- Older district map (1992 to 2000)
US House, New Jersey District 7, 1996, every candidate Candidate Party Votes and share Share RepublicanBob FranksWon Republican 128,82155.4% DemocraticLarry Lerner Democratic 97,28541.8% IndependentDorothy Delaura Independent 4,0761.8% IndependentNicholas W Gentile Independent 1,6930.7% IndependentRobert G Robertson Independent 6960.3% - Votes for listed candidates
- 165,857
- Election day
- November 8, 1994
- District map
- Older district map (1992 to 2000)
US House, New Jersey District 7, 1994, every candidate Candidate Party Votes and share Share RepublicanBob FranksWon Republican 98,81459.6% DemocraticKaren Carroll Democratic 64,23138.7% OtherJames J Cleary Other 2,3311.4% OtherClaire Greene Other 4810.3% - Votes for listed candidates
- 248,082
- Election day
- November 3, 1992
- District map
- Older district map (1992 to 2000)
US House, New Jersey District 7, 1992, every candidate Candidate Party Votes and share Share RepublicanBob FranksWon Republican 132,17453.3% DemocraticLeonard R Sendelsky Democratic 105,76142.6% IndependentEugene J Gillespie Jr Independent 4,0431.6% OtherBill Campbell Other 2,6121.1% LibertarianSpencer Layman Libertarian 1,9640.8% OtherJohn L Kucek Other 8440.3% OtherKevin Michael Criss Other 6840.3% - Votes for listed candidates
- 134,072
- Election day
- November 6, 1990
- District map
- Older district map (1982 to 1990)
US House, New Jersey District 7, 1990, every candidate Candidate Party Votes and share Share RepublicanMatthew J RinaldoWon Republican 100,06674.6% DemocraticBruce H Bergen Democratic 31,09923.2% OtherThomas V Sarnowski Other 2,9072.2% - Votes for listed candidates
- 205,539
- Election day
- November 8, 1988
- District map
- Older district map (1982 to 1990)
US House, New Jersey District 7, 1988, every candidate Candidate Party Votes and share Share RepublicanMatthew J RinaldoWon Republican 153,35074.6% DemocraticJames Hely Democratic 52,18925.4% - Votes for listed candidates
- 116,716
- Election day
- November 4, 1986
- District map
- Older district map (1982 to 1990)
US House, New Jersey District 7, 1986, every candidate Candidate Party Votes and share Share RepublicanMatthew J RinaldoWon Republican 92,25479.0% DemocraticJune S Fischer Democratic 24,46221.0% - Votes for listed candidates
- 223,282
- Election day
- November 6, 1984
- District map
- Older district map (1982 to 1990)
US House, New Jersey District 7, 1984, every candidate Candidate Party Votes and share Share RepublicanMatthew J RinaldoWon Republican 165,68574.2% DemocraticJohn F Feeley Democratic 56,79825.4% LibertarianPaul Nelson Libertarian 7990.4% - Votes for listed candidates
- 164,109
- Election day
- November 2, 1982
- District map
- Older district map (1982 to 1990)
US House, New Jersey District 7, 1982, every candidate Candidate Party Votes and share Share RepublicanMatthew J RinaldoWon Republican 91,83756.0% DemocraticAdam K Levin Democratic 70,97843.3% LibertarianDonald B Siano Libertarian 1,2940.8% - Votes for listed candidates
- 214,343
- Election day
- November 4, 1980
- District map
- Older district map (1972 to 1980)
US House, New Jersey District 7, 1980, every candidate Candidate Party Votes and share Share RepublicanMarge RoukemaWon Republican 108,76050.7% DemocraticAndrew Maguire Democratic 99,73746.5% OtherPatrick Randazzo Other 3,5941.7% LibertarianRobert Shapiro Libertarian 1,6400.8% IndependentMartin E Wendelken Independent 6120.3% - Votes for listed candidates
- 149,118
- Election day
- November 7, 1978
- District map
- Older district map (1972 to 1980)
US House, New Jersey District 7, 1978, every candidate Candidate Party Votes and share Share DemocraticAndrew MaguireWon Democratic 78,35852.5% RepublicanMargaret S Roukema Republican 69,54346.6% LibertarianRobert Shapiro Libertarian 9740.7% OtherElliot Greenspan Other 2430.2% - Votes for listed candidates
- 213,150
- Election day
- November 2, 1976
- District map
- Older district map (1972 to 1980)
US House, New Jersey District 7, 1976, every candidate Candidate Party Votes and share Share DemocraticAndrew MaguireWon Democratic 120,52656.5% RepublicanJames J Sheehan Republican 92,62443.5%
1976 to 2024: MIT Election Data and Science Lab, U.S. House 1976-2024, retrieved Oct 28, 2026. Compiled by MIT Election Data and Science Lab (MEDSL) from official returns; not an official source
District numbers are reused after each redistricting, so rows on older lines cover different territory than today's New Jersey District 7.
Download and cite
Cite this page
Election Wrld. (2026). New Jersey District 7, US House results. https://www.electionwrld.com/nj/congress/7. Retrieved October 31, 2026.
Embed this seat
<iframe src="https://www.electionwrld.com/embed/nj/congress/7" title="New Jersey District 7, US House" width="100%" height="400" style="border:0;max-width:640px" loading="lazy"></iframe>
<p style="font-size:13px">Data: <a href="https://www.electionwrld.com">Election Wrld</a>, CC BY 4.0</p>Sources
Sources: MIT Election Data and Science Lab, U.S. House 1976-2024 (CC0 1.0), retrieved Oct 28, 2026, compiled by MIT Election Data and Science Lab (MEDSL) from official returns, not an official source; Census TIGERweb Legislative MapServer (120th CDs layer 0, 119th CDs layer 4, 2026 SLD upper layer 1 and lower layer 2) (US Census Bureau, public domain), retrieved Oct 28, 2026; unitedstates/congress-legislators (current) (CC0-1.0), retrieved Oct 28, 2026, compiled by the @unitedstates project volunteers (rosters from official congressional sources) from official returns, not an official source.
DataState data (JSON)Sources: MIT Election Data and Science Lab, U.S. House 1976-2024, VoteHub polls (CC BY 4.0), FEC, DIME (ODC-BY), Portraits: unitedstates/images (public domain)Data as of Oct 30, 2026 (candidate list Oct 28, 2026)