

New Jersey District 6
Tue, Nov 3 · Seat held by Frank Pallone, Jr. Democratic since Jan 1987
No published poll names both candidates.Last result · 2024 general: Frank Pallone, Jr. (D) 56.1, Scott Fegler (R) 40.3, Fahad Akhtar (O) 1.6
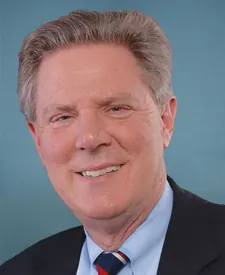
- Last election
- Frank Pallone, Jr. (Democratic) won by 15.8 points, 2024
- Margin since 2022
- 0.7 points toward Republicans
- On the 2026 ballot
- 2 candidates
Side by side
Left column: HerzigRight column: Pallone
- Total receipts, 2025-2026 cycle, through Oct 14
- $12K
- $2.8M
- Cash on hand
- $614
- $3.1M
- Donor-based spectrum
- LiberalCentristConservativePalloneNo published score for Herzig
- Races
- None listed
- Won 19 of 19
- Years since first win
- Not available
- 39
- Age on Election Day
- Not available
- 75
Money: FEC bulk data, through Oct 14. One or more are matched to the FEC by name, party and seat, so a total could belong to someone else.
How these are counted
Total receipts line of each candidate’s principal campaign committee, 2025-2026 cycle. Other sites may show career, six-year or all-committee totals, which differ. Herzig: $11,766 received, $614 cash on hand. Pallone: $2,844,906 received, $3,069,517 cash on hand. The spectrum is a published research score, not our rating. How this works. Wins and losses count the races in our results files, the same as each profile.
More about this race
Candidates on the ballot
- Frank Pallone, Jr.IncumbentDemocratic
- Hillary HerzigRepublican
Source: nj.gov (PDF), dated Sep 4
Shift since 2022: 0.7 points toward Republicans (Democratic by 16.5 in 2022, Democratic by 15.8 in 2024).
All New Jersey districts
- D 15+ pts
- D 5 to 15 pts
- D under 5 pts
- R under 5 pts
- R 5 to 15 pts
- R 15+ pts
- Other winner
- No data
Show these districts as a list (12)
- New Jersey District 1· Donald Norcross (D), Democratic by 17.8 points, 2024
- New Jersey District 2· Jefferson Van Drew (R), Republican by 16.9 points, 2024
- New Jersey District 3· Herbert C. Conaway, Jr. (D), Democratic by 8.5 points, 2024
- New Jersey District 4· Christopher H. Smith (R), Republican by 35.7 points, 2024
- New Jersey District 5· Josh Gottheimer (D), Democratic by 11.3 points, 2024
- New Jersey District 6· Frank Pallone, Jr. (D), Democratic by 15.8 points, 2024
- New Jersey District 7· Thomas H. Kean, Jr. (R), Republican by 5.4 points, 2024
- New Jersey District 8· Robert Menendez (D), Democratic by 24.6 points, 2024
- New Jersey District 9· Nellie Pou (D), Democratic by 4.9 points, 2024
- New Jersey District 10· LaMonica McIver (D), Democratic by 52.2 points, 2024
- New Jersey District 11· Mikie Sherrill (D), Democratic by 14.7 points, 2024
- New Jersey District 12· Bonnie Watson Coleman (D), Democratic by 24.8 points, 2024
Map settings
Vote in New Jersey
Trouble voting? Election Protection hotline: 866-OUR-VOTE. A nonpartisan coalition of civil-rights and voting-rights groups, not a government service. 866ourvote.org
Official results for New Jersey
History (25 elections for this seat)
- Votes for listed candidates
- 303,681
- Election day
- November 5, 2024
- District map
- Same as today
US House, New Jersey District 6, 2024, every candidate Candidate Party Votes and share Share DemocraticFrank Pallone, Jr.Won Democratic 170,27556.1% RepublicanScott Fegler Republican 122,51940.3% OtherFahad Akhtar Other 4,8711.6% GreenHerb Tarbous Green 4,2461.4% LibertarianMatthew Amitrano Libertarian 1,7700.6% - Votes for listed candidates
- 184,919
- Election day
- November 8, 2022
- District map
- Same as today
US House, New Jersey District 6, 2022, every candidate Candidate Party Votes and share Share DemocraticFrank Pallone, Jr.Won Democratic 106,23857.5% RepublicanSusan M Kiley Republican 75,83941.0% LibertarianTara Fisher Libertarian 1,3610.7% OtherInder Jit Soni Other 9470.5% OtherEric Antisell Other 5340.3% - Votes for listed candidates
- 326,408
- Election day
- November 3, 2020
- District map
- Older district map (2012 to 2020)
US House, New Jersey District 6, 2020, every candidate Candidate Party Votes and share Share DemocraticFrank Pallone, Jr.Won Democratic 199,64861.2% RepublicanChristian Onuoha Republican 126,76038.8% - Votes for listed candidates
- 221,195
- Election day
- November 6, 2018
- District map
- Older district map (2012 to 2020)
US House, New Jersey District 6, 2018, every candidate Candidate Party Votes and share Share DemocraticFrank Pallone, Jr.Won Democratic 140,75263.6% RepublicanRichard J Pezzullo Republican 80,44336.4% - Votes for listed candidates
- 263,435
- Election day
- November 8, 2016
- District map
- Older district map (2012 to 2020)
US House, New Jersey District 6, 2016, every candidate Candidate Party Votes and share Share DemocraticFrank Pallone, Jr.Won Democratic 167,89563.7% RepublicanBrent Sonnek-Schmelz Republican 91,90834.9% GreenRajit B Malliah Green 1,9120.7% LibertarianJudith Shamy Libertarian 1,7200.7% - Votes for listed candidates
- 120,457
- Election day
- November 4, 2014
- District map
- Older district map (2012 to 2020)
US House, New Jersey District 6, 2014, every candidate Candidate Party Votes and share Share DemocraticFrank Pallone, Jr.Won Democratic 72,19059.9% RepublicanAnthony E Wilkinson Republican 46,89138.9% LibertarianDorit Goikhman Libertarian 1,3761.1% - Votes for listed candidates
- 239,638
- Election day
- November 6, 2012
- District map
- Older district map (2012 to 2020)
US House, New Jersey District 6, 2012, every candidate Candidate Party Votes and share Share DemocraticFrank Pallone, Jr.Won Democratic 151,78263.3% RepublicanAnna Little Republican 84,36035.2% LibertarianLen Flynn Libertarian 1,3920.6% OtherKaren Zaletel Other 8680.4% IndependentMac Dara Lyden Independent 8300.3% OtherHerbert L Tarbous Other 4060.2% - Votes for listed candidates
- 149,662
- Election day
- November 2, 2010
- District map
- Older district map (2002 to 2010)
US House, New Jersey District 6, 2010, every candidate Candidate Party Votes and share Share DemocraticFrank Pallone, Jr.Won Democratic 81,93354.7% RepublicanAnna C Little Republican 65,41343.7% IndependentJack Freudenheim Independent 1,2990.9% OtherKaren Anne Zaletel Other 1,0170.7% - Votes for listed candidates
- 245,077
- Election day
- November 4, 2008
- District map
- Older district map (2002 to 2010)
US House, New Jersey District 6, 2008, every candidate Candidate Party Votes and share Share DemocraticFrank Pallone, Jr.Won Democratic 164,07766.9% RepublicanRobert E McLeod Republican 77,46931.6% IndependentHerb Tarbous Independent 3,5311.4% - Votes for listed candidates
- 143,773
- Election day
- November 7, 2006
- District map
- Older district map (2002 to 2010)
US House, New Jersey District 6, 2006, every candidate Candidate Party Votes and share Share DemocraticFrank Pallone, Jr.Won Democratic 98,61568.6% RepublicanLeigh-Ann Bellew Republican 43,53930.3% OtherHerbert L Tarbous Other 1,6191.1% - Votes for listed candidates
- 230,151
- Election day
- November 2, 2004
- District map
- Older district map (2002 to 2010)
US House, New Jersey District 6, 2004, every candidate Candidate Party Votes and share Share DemocraticFrank Pallone, Jr.Won Democratic 153,98166.9% RepublicanSylvester Fernandez Republican 70,94230.8% IndependentVirginia A Flynn Independent 2,8291.2% IndependentMac Dara F X Lyden Independent 2,3991.0% - Votes for listed candidates
- 137,495
- Election day
- November 5, 2002
- District map
- Older district map (2002 to 2010)
US House, New Jersey District 6, 2002, every candidate Candidate Party Votes and share Share DemocraticFrank Pallone, Jr.Won Democratic 91,37966.5% RepublicanRic Medrow Republican 42,47930.9% GreenRichard D Strong Green 1,8191.3% LibertarianBarry Allen Libertarian 1,2060.9% OtherMac Dara Francis X Lyden Other 6120.4% - Votes for listed candidates
- 209,852
- Election day
- November 7, 2000
- District map
- Older district map (1992 to 2000)
US House, New Jersey District 6, 2000, every candidate Candidate Party Votes and share Share DemocraticFrank Pallone, Jr.Won Democratic 141,69867.5% RepublicanBrian T Kennedy Republican 62,45429.8% IndependentEarl Gray Independent 4,2522.0% IndependentKaren Zaletel Independent 1,1200.5% IndependentSylvia Kuzmak Independent 3280.2% - Votes for listed candidates
- 137,012
- Election day
- November 3, 1998
- District map
- Older district map (1992 to 2000)
US House, New Jersey District 6, 1998, every candidate Candidate Party Votes and share Share DemocraticFrank Pallone, Jr.Won Democratic 78,10257.0% RepublicanMichael Ferguson Republican 55,18040.3% IndependentCarl J Mayer Independent 1,2910.9% IndependentSteve Nagle Independent 1,2620.9% IndependentLeonard P Marshall Independent 1,1770.9% - Votes for listed candidates
- 203,478
- Election day
- November 5, 1996
- District map
- Older district map (1992 to 2000)
US House, New Jersey District 6, 1996, every candidate Candidate Party Votes and share Share DemocraticFrank Pallone, Jr.Won Democratic 124,63561.3% RepublicanSteven J Corodemus Republican 73,40236.1% IndependentKeith Quarles Independent 2,0441.0% IndependentRichard Sorrentino Independent 1,5090.7% IndependentSusan H Normandin Independent 1,2470.6% IndependentStefanie C Trice Independent 6410.3% - Votes for listed candidates
- 147,331
- Election day
- November 8, 1994
- District map
- Older district map (1992 to 2000)
US House, New Jersey District 6, 1994, every candidate Candidate Party Votes and share Share DemocraticFrank Pallone, Jr.Won Democratic 88,92260.4% RepublicanMike Herson Republican 55,28737.5% OtherCharles H Dickson Other 1,7741.2% OtherGary J Rich Other 8000.5% OtherRichard Quinn Other 5480.4% - Votes for listed candidates
- 226,093
- Election day
- November 3, 1992
- District map
- Older district map (1992 to 2000)
US House, New Jersey District 6, 1992, every candidate Candidate Party Votes and share Share DemocraticFrank Pallone, Jr.Won Democratic 118,26652.3% RepublicanJoseph M Kyrillos Republican 100,94944.6% OtherJoseph Spalletta Other 2,1531.0% LibertarianBill Stewart Libertarian 1,4040.6% OtherPeter Cerrato Other 1,0730.5% OtherGeorge P Predham Other 9510.4% OtherSimone Berg Other 6130.3% OtherKenneth Matto Other 4110.2% OtherCharles H Dickson Other 2730.1% - Votes for listed candidates
- 126,022
- Election day
- November 6, 1990
- District map
- Older district map (1982 to 1990)
US House, New Jersey District 6, 1990, every candidate Candidate Party Votes and share Share DemocraticBernard J DwyerWon Democratic 63,74550.6% RepublicanPaul "Daniels" Danielczyk Republican 58,14746.1% OtherRandolph Waller Other 2,3481.9% LibertarianHoward F Schoen Libertarian 1,7821.4% - Votes for listed candidates
- 196,598
- Election day
- November 8, 1988
- District map
- Older district map (1982 to 1990)
US House, New Jersey District 6, 1988, every candidate Candidate Party Votes and share Share DemocraticBernard J DwyerWon Democratic 120,12561.1% RepublicanPeter J Sica Republican 74,82438.1% OtherJoan Paltrineri Other 1,0340.5% LibertarianHoward F Schoen Libertarian 6150.3% - Votes for listed candidates
- 97,769
- Election day
- November 4, 1986
- District map
- Older district map (1982 to 1990)
US House, New Jersey District 6, 1986, every candidate Candidate Party Votes and share Share DemocraticBernard J DwyerWon Democratic 67,46069.0% RepublicanJohn D Scalamonti Republican 28,28628.9% OtherRose "Zeidwerg" Monyek Other 2,0232.1% - Votes for listed candidates
- 212,080
- Election day
- November 6, 1984
- District map
- Older district map (1982 to 1990)
US House, New Jersey District 6, 1984, every candidate Candidate Party Votes and share Share DemocraticBernard J DwyerWon Democratic 118,53255.9% RepublicanDennis Adams Republican 90,86242.8% LibertarianStephen Friedlander Libertarian 2,6861.3% - Votes for listed candidates
- 147,434
- Election day
- November 2, 1982
- District map
- Older district map (1982 to 1990)
US House, New Jersey District 6, 1982, every candidate Candidate Party Votes and share Share DemocraticBernard J DwyerWon Democratic 100,41968.1% RepublicanBertram L Buckler Republican 46,09531.3% LibertarianCharles M Hart Libertarian 9200.6% - Votes for listed candidates
- 223,254
- Election day
- November 4, 1980
- District map
- Older district map (1972 to 1980)
US House, New Jersey District 6, 1980, every candidate Candidate Party Votes and share Share RepublicanEdwin B ForsytheWon Republican 125,79256.3% DemocraticLewis M Weinstein Democratic 92,22741.3% LibertarianVirginia A Flynn Libertarian 2,1651.0% OtherJohn Kinnevy III Other 1,8480.8% OtherDonald L Smith Other 6660.3% OtherBernardo S Doganiero Other 5560.2% - Votes for listed candidates
- 148,184
- Election day
- November 7, 1978
- District map
- Older district map (1972 to 1980)
US House, New Jersey District 6, 1978, every candidate Candidate Party Votes and share Share RepublicanEdwin B ForsytheWon Republican 89,44660.4% DemocraticW Thomas McGann Democratic 56,87438.4% OtherBernardo S Doganiero Other 7370.5% LibertarianCharles M Pike Jr Libertarian 6430.4% OtherHazel McGlory Other 4840.3% - Votes for listed candidates
- 214,304
- Election day
- November 2, 1976
- District map
- Older district map (1972 to 1980)
US House, New Jersey District 6, 1976, every candidate Candidate Party Votes and share Share RepublicanEdwin B ForsytheWon Republican 125,92058.8% DemocraticCatherine A Costa Democratic 85,05339.7% OtherRichard D Amber Other 1,1540.5% LibertarianSamuel E Brown Libertarian 1,0160.5% IndependentJoseph J Byrne Independent 9330.4% OtherMarc David Silverstein Other 2280.1%
1976 to 2024: MIT Election Data and Science Lab, U.S. House 1976-2024, retrieved Oct 28, 2026. Compiled by MIT Election Data and Science Lab (MEDSL) from official returns; not an official source
District numbers are reused after each redistricting, so rows on older lines cover different territory than today's New Jersey District 6.
Download and cite
Cite this page
Election Wrld. (2026). New Jersey District 6, US House results. https://www.electionwrld.com/nj/congress/6. Retrieved October 30, 2026.
Embed this seat
<iframe src="https://www.electionwrld.com/embed/nj/congress/6" title="New Jersey District 6, US House" width="100%" height="400" style="border:0;max-width:640px" loading="lazy"></iframe>
<p style="font-size:13px">Data: <a href="https://www.electionwrld.com">Election Wrld</a>, CC BY 4.0</p>Sources
Sources: MIT Election Data and Science Lab, U.S. House 1976-2024 (CC0 1.0), retrieved Oct 28, 2026, compiled by MIT Election Data and Science Lab (MEDSL) from official returns, not an official source; Census TIGERweb Legislative MapServer (120th CDs layer 0, 119th CDs layer 4, 2026 SLD upper layer 1 and lower layer 2) (US Census Bureau, public domain), retrieved Oct 28, 2026; unitedstates/congress-legislators (current) (CC0-1.0), retrieved Oct 28, 2026, compiled by the @unitedstates project volunteers (rosters from official congressional sources) from official returns, not an official source.
DataState data (JSON)Sources: MIT Election Data and Science Lab, U.S. House 1976-2024, FEC, DIME (ODC-BY), Portraits: unitedstates/images (public domain)Data as of Oct 28, 2026